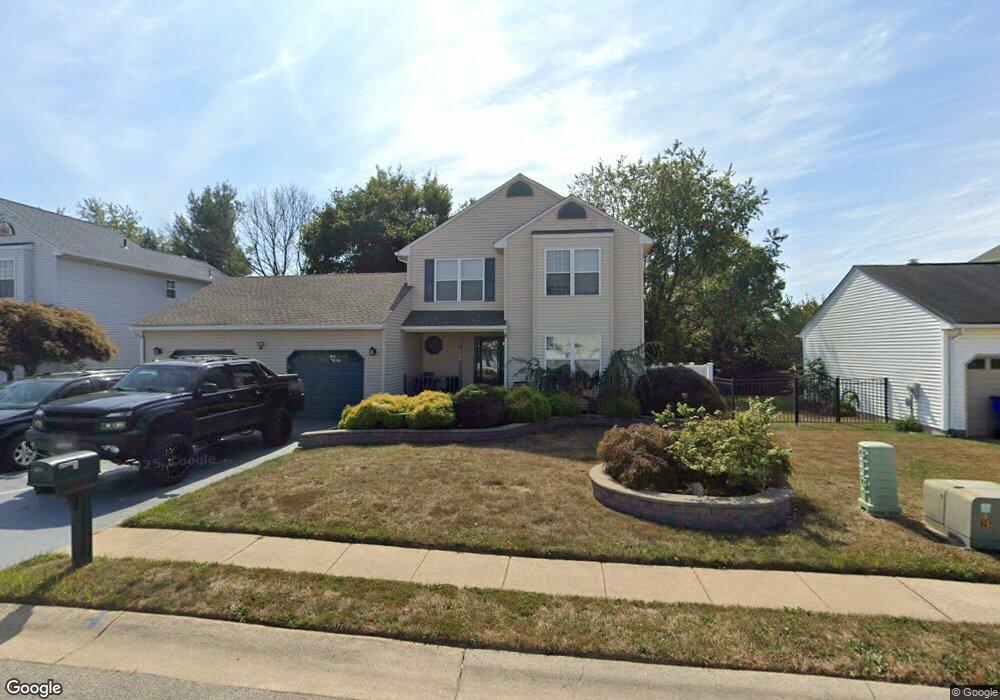
169 Sugarberry Dr New Castle, DE 19720
Estimated Value: $306,000 - $419,389
3
Beds
2
Baths
1,836
Sq Ft
$203/Sq Ft
Est. Value
About This Home
This home is located at 169 Sugarberry Dr, New Castle, DE 19720 and is currently estimated at $372,097, approximately $202 per square foot. 169 Sugarberry Dr is a home located in New Castle County with nearby schools including Kathleen H. Wilbur Elementary School, Gunning Bedford Middle School, and Red Lion Christian Academy.
Ownership History
Date
Name
Owned For
Owner Type
Purchase Details
Closed on
Apr 10, 2007
Sold by
Sagers Clyde Dean and Fister Allison B
Bought by
Sagers Clyde Dean
Current Estimated Value
Home Financials for this Owner
Home Financials are based on the most recent Mortgage that was taken out on this home.
Original Mortgage
$227,000
Outstanding Balance
$144,419
Interest Rate
7.12%
Mortgage Type
Purchase Money Mortgage
Estimated Equity
$227,678
Purchase Details
Closed on
Apr 26, 2005
Sold by
Hilyard Leslie
Bought by
Fisher Allison B and Sagers Clyde Dean
Home Financials for this Owner
Home Financials are based on the most recent Mortgage that was taken out on this home.
Original Mortgage
$176,000
Interest Rate
5.95%
Mortgage Type
Fannie Mae Freddie Mac
Create a Home Valuation Report for This Property
The Home Valuation Report is an in-depth analysis detailing your home's value as well as a comparison with similar homes in the area
Home Values in the Area
Average Home Value in this Area
Purchase History
| Date | Buyer | Sale Price | Title Company |
|---|---|---|---|
| Sagers Clyde Dean | $31,400 | None Available | |
| Fisher Allison B | $220,000 | -- |
Source: Public Records
Mortgage History
| Date | Status | Borrower | Loan Amount |
|---|---|---|---|
| Open | Sagers Clyde Dean | $227,000 | |
| Previous Owner | Fisher Allison B | $176,000 |
Source: Public Records
Tax History Compared to Growth
Tax History
| Year | Tax Paid | Tax Assessment Tax Assessment Total Assessment is a certain percentage of the fair market value that is determined by local assessors to be the total taxable value of land and additions on the property. | Land | Improvement |
|---|---|---|---|---|
| 2024 | $2,305 | $66,400 | $9,800 | $56,600 |
| 2023 | $2,099 | $66,400 | $9,800 | $56,600 |
| 2022 | $2,183 | $66,400 | $9,800 | $56,600 |
| 2021 | $2,181 | $66,400 | $9,800 | $56,600 |
| 2020 | $2,189 | $66,400 | $9,800 | $56,600 |
| 2019 | $2,725 | $66,400 | $9,800 | $56,600 |
| 2018 | $2,153 | $66,400 | $9,800 | $56,600 |
| 2017 | $1,958 | $66,400 | $9,800 | $56,600 |
| 2016 | $1,746 | $64,500 | $9,800 | $54,700 |
| 2015 | $1,748 | $64,500 | $9,800 | $54,700 |
| 2014 | $1,751 | $64,500 | $9,800 | $54,700 |
Source: Public Records
Map
Nearby Homes
- 233 Romeo Dr
- 129 Kingston Dr
- 6 Shamrock Ave
- 17 W Violette Dr
- 1500 Bear Corbitt Rd
- 16 Lochview Dr
- 254 Rushes Dr
- 28 Paxton Ln
- 170 Channing Dr
- 121 Wynnefield Rd
- 1239 Red Lion Rd
- 118 Mcmullen Cir
- 104 Channing Dr
- 114 Rosemary Ct
- 6 Harpers Place
- 22 Carper St
- 405 Monmouth Place
- 68 Liborio Ln
- 78 Grand National Ln Unit 65
- 33 W Saxony Dr