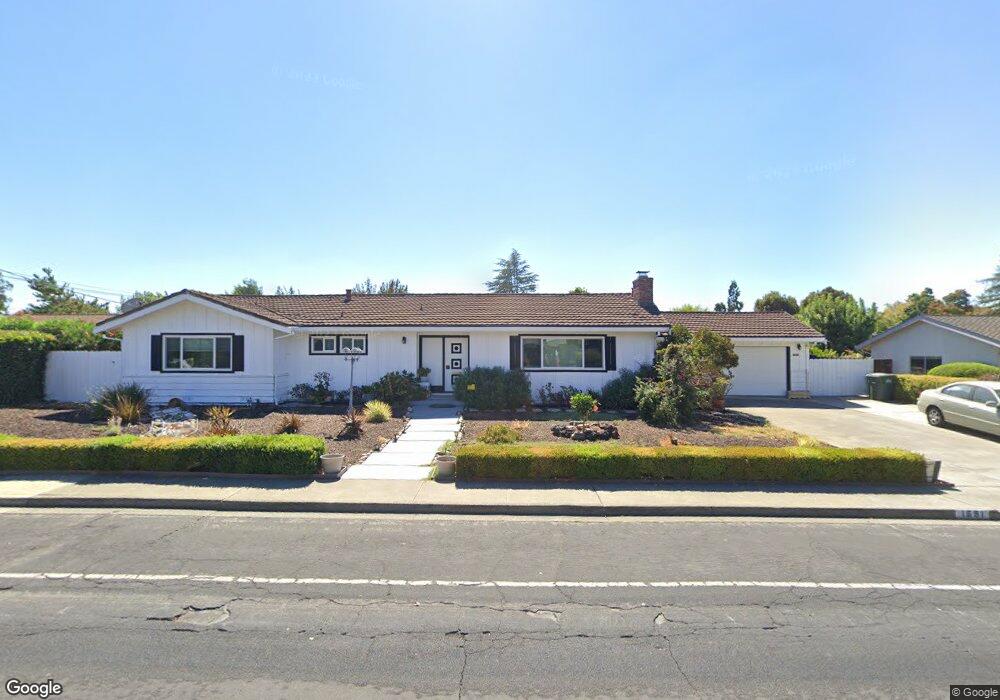
1691 Clayton Way Concord, CA 94519
Parkside NeighborhoodEstimated Value: $831,000 - $838,000
3
Beds
2
Baths
1,762
Sq Ft
$473/Sq Ft
Est. Value
About This Home
This home is located at 1691 Clayton Way, Concord, CA 94519 and is currently estimated at $833,556, approximately $473 per square foot. 1691 Clayton Way is a home located in Contra Costa County with nearby schools including Westwood Elementary School, El Dorado Middle School, and Concord High School.
Ownership History
Date
Name
Owned For
Owner Type
Purchase Details
Closed on
Jun 25, 2024
Sold by
Rowell Frederic C and Smith Ethel S
Bought by
Rowell Spencer-Smith Living Trust and Rowell
Current Estimated Value
Purchase Details
Closed on
Feb 28, 2019
Sold by
Verzosa Marie C and Tavares Marie
Bought by
Rowell Frederic C and Smith Ethel S
Home Financials for this Owner
Home Financials are based on the most recent Mortgage that was taken out on this home.
Original Mortgage
$580,072
Interest Rate
4.4%
Mortgage Type
VA
Purchase Details
Closed on
Feb 27, 2006
Sold by
Paul Alfred W and Paul Virginia L
Bought by
Tavares Marie
Home Financials for this Owner
Home Financials are based on the most recent Mortgage that was taken out on this home.
Original Mortgage
$504,000
Interest Rate
6.5%
Mortgage Type
New Conventional
Create a Home Valuation Report for This Property
The Home Valuation Report is an in-depth analysis detailing your home's value as well as a comparison with similar homes in the area
Home Values in the Area
Average Home Value in this Area
Purchase History
| Date | Buyer | Sale Price | Title Company |
|---|---|---|---|
| Rowell Spencer-Smith Living Trust | -- | None Listed On Document | |
| Rowell Frederic C | $635,000 | Chicago Title Company | |
| Tavares Marie | $630,000 | Fidelity National Title Co |
Source: Public Records
Mortgage History
| Date | Status | Borrower | Loan Amount |
|---|---|---|---|
| Previous Owner | Rowell Frederic C | $580,072 | |
| Previous Owner | Tavares Marie | $504,000 |
Source: Public Records
Tax History Compared to Growth
Tax History
| Year | Tax Paid | Tax Assessment Tax Assessment Total Assessment is a certain percentage of the fair market value that is determined by local assessors to be the total taxable value of land and additions on the property. | Land | Improvement |
|---|---|---|---|---|
| 2025 | $8,290 | $686,039 | $446,205 | $239,834 |
| 2024 | $8,135 | $672,588 | $437,456 | $235,132 |
| 2023 | $8,135 | $659,401 | $428,879 | $230,522 |
| 2022 | $8,028 | $646,472 | $420,470 | $226,002 |
| 2021 | $7,832 | $633,797 | $412,226 | $221,571 |
| 2019 | $8,160 | $650,000 | $454,796 | $195,204 |
| 2018 | $7,160 | $575,000 | $402,320 | $172,680 |
| 2017 | $6,486 | $524,000 | $366,635 | $157,365 |
| 2016 | $6,291 | $512,000 | $358,239 | $153,761 |
| 2015 | $5,399 | $430,500 | $301,214 | $129,286 |
| 2014 | $4,851 | $382,000 | $267,280 | $114,720 |
Source: Public Records
Map
Nearby Homes
- 1693 Greentree Dr
- 1662 Dorchester Place
- 4022 Wilson Ln
- 4048 Chestnut Ave
- 4044 Chestnut Ave
- 1685 Westchester Place
- 1715 West St
- 1579 West St
- 4081 Salem St
- 4020 Salem St
- 4067 Lillian Dr
- 1682 Mendocino Dr
- 1604 Chestnut Ct
- 1739 Sapling Ct Unit A
- 4081 Clayton Rd Unit 117
- 3718 Northpark Ct
- 1540 Farm Bureau Rd
- 1512 Farm Bureau Rd
- 3901 Clayton Rd Unit 57
- 1828 Clayton Way
- 78 Ceemar Ct
- 1683 Clayton Way
- 1699 Clayton Way
- 84 Ceemar Ct
- 34 Ceemar Ct
- 1660 Clayton Way
- 48 Ceemar Ct
- 1666 Clayton Way
- 1654 Clayton Way
- 3952 Walnut Ave
- 22 Ceemar Ct
- 1672 Clayton Way
- 1648 Clayton Way
- 87 Ceemar Ct
- 1642 Clayton Way Unit 4
- 1642 Clayton Way
- 1678 Clayton Way
- 3948 Walnut Ave
- 4049 Susanwood Dr
- 4043 Susanwood Dr