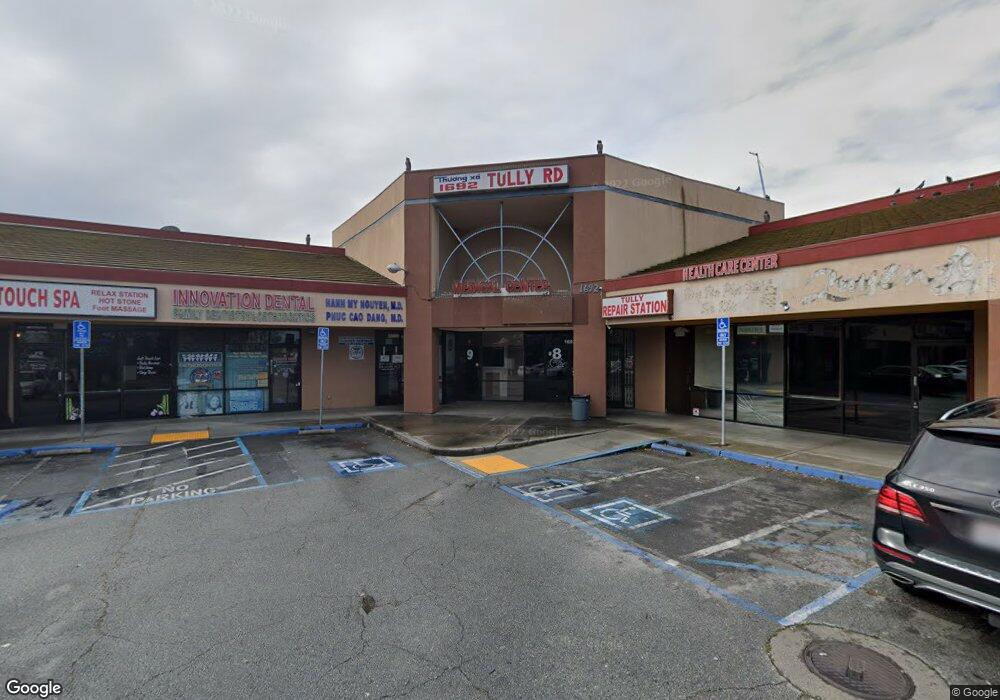
1692 Tully Rd Unit 12 San Jose, CA 95122
Leyva NeighborhoodEstimated Value: $415,088
--
Bed
--
Bath
931
Sq Ft
$446/Sq Ft
Est. Value
About This Home
This home is located at 1692 Tully Rd Unit 12, San Jose, CA 95122 and is currently estimated at $415,088, approximately $445 per square foot. 1692 Tully Rd Unit 12 is a home located in Santa Clara County with nearby schools including O.B. Whaley Elementary School, George V. Leyva Intermediate School, and Yerba Buena High School.
Ownership History
Date
Name
Owned For
Owner Type
Purchase Details
Closed on
Feb 11, 2023
Sold by
Sera Luu Family Trust
Bought by
Tran Raymond and Le Thu Thi
Current Estimated Value
Home Financials for this Owner
Home Financials are based on the most recent Mortgage that was taken out on this home.
Original Mortgage
$300,000
Outstanding Balance
$290,277
Interest Rate
6.15%
Mortgage Type
New Conventional
Estimated Equity
$124,811
Purchase Details
Closed on
Feb 8, 2023
Sold by
Pham Sophia Luu
Bought by
Sera Luu Family Trust
Home Financials for this Owner
Home Financials are based on the most recent Mortgage that was taken out on this home.
Original Mortgage
$300,000
Outstanding Balance
$290,277
Interest Rate
6.15%
Mortgage Type
New Conventional
Estimated Equity
$124,811
Purchase Details
Closed on
Sep 30, 2011
Sold by
Luu Thinh Kim and Luu John Richard
Bought by
Pham Sophia Luu and Pham Ariel Luu
Purchase Details
Closed on
Oct 5, 1999
Sold by
Van Nguyen
Bought by
Luu Thinh Kim and Luu John Richard
Create a Home Valuation Report for This Property
The Home Valuation Report is an in-depth analysis detailing your home's value as well as a comparison with similar homes in the area
Home Values in the Area
Average Home Value in this Area
Purchase History
| Date | Buyer | Sale Price | Title Company |
|---|---|---|---|
| Tran Raymond | $375,000 | California Best Title Company | |
| Sera Luu Family Trust | -- | California Best Title | |
| Pham Sophia Luu | $165,000 | None Available | |
| Luu Thinh Kim | $190,000 | Fidelity National Title Co |
Source: Public Records
Mortgage History
| Date | Status | Borrower | Loan Amount |
|---|---|---|---|
| Open | Tran Raymond | $300,000 |
Source: Public Records
Tax History Compared to Growth
Tax History
| Year | Tax Paid | Tax Assessment Tax Assessment Total Assessment is a certain percentage of the fair market value that is determined by local assessors to be the total taxable value of land and additions on the property. | Land | Improvement |
|---|---|---|---|---|
| 2025 | $6,152 | $390,150 | $348,534 | $41,616 |
| 2024 | $6,152 | $382,500 | $341,700 | $40,800 |
| 2023 | $4,458 | $259,555 | $120,723 | $138,832 |
| 2022 | $4,490 | $254,466 | $118,356 | $136,110 |
| 2021 | $4,427 | $249,478 | $116,036 | $133,442 |
| 2020 | $4,404 | $246,921 | $114,847 | $132,074 |
| 2019 | $4,385 | $242,081 | $112,596 | $129,485 |
| 2018 | $4,338 | $237,336 | $110,389 | $126,947 |
| 2017 | $4,260 | $232,683 | $108,225 | $124,458 |
| 2016 | $4,126 | $228,121 | $106,103 | $122,018 |
| 2015 | $4,111 | $224,696 | $104,510 | $120,186 |
| 2014 | $3,893 | $220,295 | $102,463 | $117,832 |
Source: Public Records
Map
Nearby Homes
- 2647 Aida Ave
- 2040 Lanai Ave
- 1381 Taper Ct
- 2154 Pastoral Loop
- 2820 Beecher Ct
- 1944 S King Rd
- 1912 Sumatra Ave
- 1902 S King Rd
- 1058 Tekman Dr Unit 58
- 2416 Balme Dr
- 1899 Bermuda Way
- 2566 Boren Dr
- 2036 Cunningham Ave
- 2015 Tahiti Ct
- 1117 Indian Summer Ct
- 1231 Turtlerock Dr
- 1087 Summerain Ct
- 1042 Summermist Ct Unit 107
- 1050 Summermist Ct
- 2175 Summerton Dr
- 1692 Tully Rd Unit 7
- 1692 Tully Rd Unit 15
- 1692 Tully Rd Unit 6
- 1692 Tully Rd Unit 17
- 1692 Tully Rd Unit 8
- 1692 Tully Rd Unit 16
- 1692 Tully Rd Unit 9
- 1692 Tully Rd Unit 11
- 1692 Tully Rd Unit 1
- 1692 Tully Rd
- 1692 Tully Rd
- 1692 Tully Rd Unit 4 RD
- 1692 Tully Suite #4 Rd
- 1692 Tully Suite # 4 Rd
- 1661 Burdette Dr Unit Ste A2
- 1661 Burdette Dr Unit B
- 1661 Burdette Dr Unit CD
- 1661 Burdette Dr
- 1661 Burdette Dr Unit AB
- 2435 S King Rd