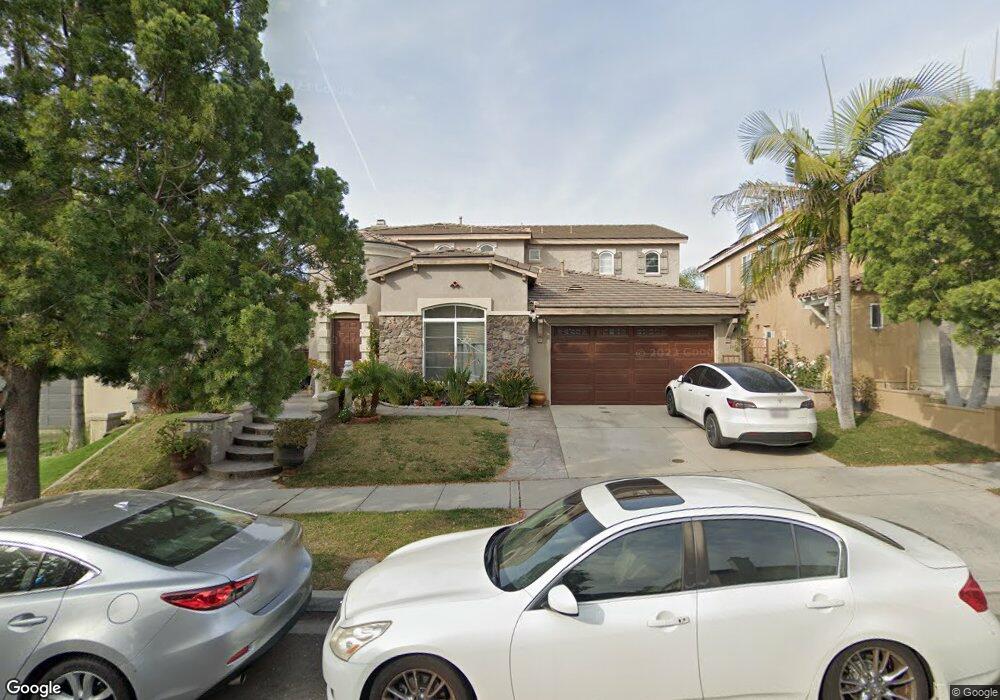
1693 San Pasqual St Chula Vista, CA 91913
Otay Ranch NeighborhoodEstimated Value: $1,146,048 - $1,272,000
5
Beds
4
Baths
3,101
Sq Ft
$390/Sq Ft
Est. Value
About This Home
This home is located at 1693 San Pasqual St, Chula Vista, CA 91913 and is currently estimated at $1,209,512, approximately $390 per square foot. 1693 San Pasqual St is a home located in San Diego County with nearby schools including Veterans Elementary School, Rancho Del Rey Middle School, and Olympian High School.
Ownership History
Date
Name
Owned For
Owner Type
Purchase Details
Closed on
Dec 18, 2022
Sold by
Halog Medardo D and Halog Arcelie G
Bought by
Halog Family Revocable Living Trust and Halog
Current Estimated Value
Purchase Details
Closed on
Dec 2, 2008
Sold by
Rendon Theresa and Rendon Juan F
Bought by
Halog Medardo and Halog Arcelie
Home Financials for this Owner
Home Financials are based on the most recent Mortgage that was taken out on this home.
Original Mortgage
$466,839
Interest Rate
6.16%
Mortgage Type
FHA
Purchase Details
Closed on
Apr 15, 2004
Sold by
Rendon Theresa
Bought by
Rendon Theresa and Rendon Juan F
Purchase Details
Closed on
Jan 15, 2004
Sold by
Otay Ranch R2a Llc
Bought by
Rendon Theresa
Home Financials for this Owner
Home Financials are based on the most recent Mortgage that was taken out on this home.
Original Mortgage
$483,840
Interest Rate
6.25%
Mortgage Type
Purchase Money Mortgage
Create a Home Valuation Report for This Property
The Home Valuation Report is an in-depth analysis detailing your home's value as well as a comparison with similar homes in the area
Home Values in the Area
Average Home Value in this Area
Purchase History
| Date | Buyer | Sale Price | Title Company |
|---|---|---|---|
| Halog Family Revocable Living Trust | -- | None Listed On Document | |
| Halog Medardo | $473,000 | Southland Title Of San Diego | |
| Rendon Theresa | -- | -- | |
| Rendon Theresa | $605,000 | Chicago Title Co |
Source: Public Records
Mortgage History
| Date | Status | Borrower | Loan Amount |
|---|---|---|---|
| Previous Owner | Halog Medardo | $466,839 | |
| Previous Owner | Rendon Theresa | $483,840 | |
| Closed | Rendon Theresa | $120,960 |
Source: Public Records
Tax History Compared to Growth
Tax History
| Year | Tax Paid | Tax Assessment Tax Assessment Total Assessment is a certain percentage of the fair market value that is determined by local assessors to be the total taxable value of land and additions on the property. | Land | Improvement |
|---|---|---|---|---|
| 2025 | $11,729 | $609,089 | $206,030 | $403,059 |
| 2024 | $11,729 | $597,147 | $201,991 | $395,156 |
| 2023 | $11,770 | $585,439 | $198,031 | $387,408 |
| 2022 | $11,458 | $573,961 | $194,149 | $379,812 |
| 2021 | $11,184 | $562,708 | $190,343 | $372,365 |
| 2020 | $10,965 | $556,939 | $188,392 | $368,547 |
| 2019 | $10,731 | $546,020 | $184,699 | $361,321 |
| 2018 | $10,679 | $535,315 | $181,078 | $354,237 |
| 2017 | $13 | $524,820 | $177,528 | $347,292 |
| 2016 | $10,155 | $514,531 | $174,048 | $340,483 |
| 2015 | $9,903 | $506,803 | $171,434 | $335,369 |
| 2014 | $9,373 | $496,876 | $168,076 | $328,800 |
Source: Public Records
Map
Nearby Homes
- 1583 Mount Tamalpais Ave Unit 1
- 1566 Calle de La Flor Unit 2
- 1518 Caminito Soria Unit 2
- 1676 Oconnor Ave
- 1679 Kincaid Ave
- 1682 May Ave
- 2097 Bluestone Cir
- 1548 Hunters Glen Ave
- 1757 Barbour Ave
- 1555 Tomillo Ln
- 1915 Caminito de la Cruz
- 1518 Piedmont St
- 1448 Water Lily Dr Unit 1
- 1875 Baudouin Place Unit 1731
- 1631 Applegate St
- 1401 Caminito Capistrano Unit 1
- 1614 Sanderling Ave Unit 6
- 1622 Puffin Place Unit 3
- 1665 Santa Alexia Ave Unit 1
- 1423 Shearwater St Unit 1
- 1689 San Pasqual St
- 1697 San Pasqual St Unit 1
- 1692 San Anselmo St
- 1688 San Anselmo St
- 1696 San Anselmo St
- 1685 San Pasqual St
- 1588 Lokoya Dr
- 1571 Golden Gate Ave
- 1684 San Anselmo St
- 1681 San Pasqual St
- 1575 Golden Gate Ave
- 1680 San Anselmo St
- 1579 Lokoya Dr Unit 1
- 1592 Lokoya Dr Unit 1
- 1583 Lokoya Dr
- 1575 Lokoya Dr
- 1587 Lokoya Dr
- 1677 San Pasqual St
- 1571 Lokoya Dr
- 1591 Lokoya Dr