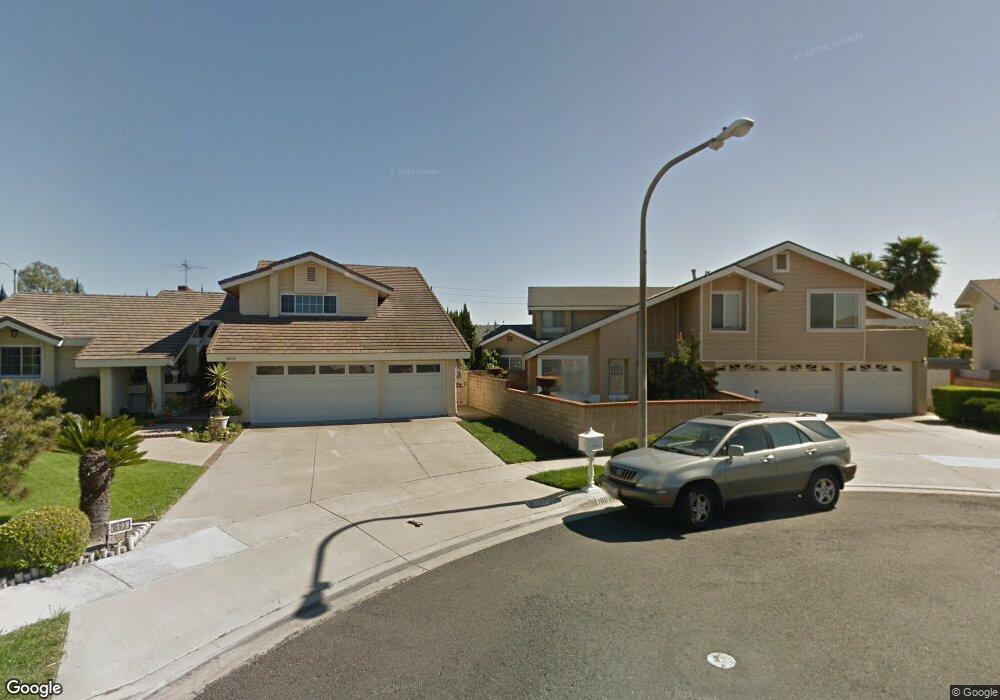
16939 Mount Hanna Cir Fountain Valley, CA 92708
Estimated Value: $1,594,000 - $1,915,000
5
Beds
4
Baths
3,117
Sq Ft
$581/Sq Ft
Est. Value
About This Home
This home is located at 16939 Mount Hanna Cir, Fountain Valley, CA 92708 and is currently estimated at $1,810,196, approximately $580 per square foot. 16939 Mount Hanna Cir is a home located in Orange County with nearby schools including Plavan (Urbain H.) Elementary School, Masuda (Kazuo) Middle School, and Fountain Valley High School.
Ownership History
Date
Name
Owned For
Owner Type
Purchase Details
Closed on
Jan 9, 2008
Sold by
Ngo Bay V
Bought by
Ngo Bay Vinh and Bay Vinh Ngo Living Trust
Current Estimated Value
Purchase Details
Closed on
Nov 4, 2002
Sold by
Ngo Bay V
Bought by
Ngo Bay
Home Financials for this Owner
Home Financials are based on the most recent Mortgage that was taken out on this home.
Original Mortgage
$206,000
Interest Rate
5.95%
Purchase Details
Closed on
Nov 2, 1994
Sold by
Ngo Bay Vinh
Bought by
Ngo Bay and Ngo Family Trust
Purchase Details
Closed on
Jul 9, 1993
Sold by
Yoshida Keiji and Yoshida Yukiko
Bought by
Ngo Bay Vinh
Home Financials for this Owner
Home Financials are based on the most recent Mortgage that was taken out on this home.
Original Mortgage
$238,000
Interest Rate
6.75%
Create a Home Valuation Report for This Property
The Home Valuation Report is an in-depth analysis detailing your home's value as well as a comparison with similar homes in the area
Home Values in the Area
Average Home Value in this Area
Purchase History
| Date | Buyer | Sale Price | Title Company |
|---|---|---|---|
| Ngo Bay Vinh | -- | None Available | |
| Ngo Bay | -- | Fidelity National Title | |
| Ngo Bay | -- | -- | |
| Ngo Bay Vinh | $297,500 | Gateway Title Company |
Source: Public Records
Mortgage History
| Date | Status | Borrower | Loan Amount |
|---|---|---|---|
| Closed | Ngo Bay | $206,000 | |
| Previous Owner | Ngo Bay Vinh | $238,000 |
Source: Public Records
Tax History Compared to Growth
Tax History
| Year | Tax Paid | Tax Assessment Tax Assessment Total Assessment is a certain percentage of the fair market value that is determined by local assessors to be the total taxable value of land and additions on the property. | Land | Improvement |
|---|---|---|---|---|
| 2025 | $6,494 | $584,638 | $257,456 | $327,182 |
| 2024 | $6,494 | $573,175 | $252,408 | $320,767 |
| 2023 | $6,340 | $561,937 | $247,459 | $314,478 |
| 2022 | $6,246 | $550,919 | $242,607 | $308,312 |
| 2021 | $6,125 | $540,117 | $237,850 | $302,267 |
| 2020 | $6,088 | $534,579 | $235,411 | $299,168 |
| 2019 | $5,963 | $524,098 | $230,796 | $293,302 |
| 2018 | $5,848 | $513,822 | $226,271 | $287,551 |
| 2017 | $5,755 | $503,748 | $221,835 | $281,913 |
| 2016 | $5,507 | $493,871 | $217,485 | $276,386 |
| 2015 | $5,422 | $486,453 | $214,218 | $272,235 |
| 2014 | $5,315 | $476,925 | $210,022 | $266,903 |
Source: Public Records
Map
Nearby Homes
- 17210 San Mateo St Unit 25
- 17333 Brookhurst St Unit D6
- 16767 Madrone Cir
- 16806 Olive St
- 17215 Buttonwood St
- 9446 Gardenia Ave
- 10452 Circulo de Juarez
- 18021 Roch Ct
- 18016 Roch Ct
- 17441 Ash St
- 9801 Hibiscus Ave
- 9429 El Valle Ave
- 17077 Los Modelos St
- 17641 Los Jardines W
- 10430 La Cebra Ave
- 17288 San Lorenzo Cir
- 17349 Los Amigos Cir
- 15781 Clarendon St
- 9796 Scanlan Ct
- 17401 Hood Ct
- 16935 Mount Hanna Cir
- 16938 Mount Hanna Cir
- 16927 Mount Hanna Cir
- 16928 Mount Hanna Cir
- 16916 Mount Hanna Cir
- 16917 Mount Hanna Cir
- 16930 Mount Gale Cir
- 9930 Merced River Ave
- 16938 Mount Gale Cir
- 9918 Merced River Ave
- 9955 Merced River Ave
- 9969 Merced River Ave
- 9941 Merced River Ave
- 9981 Merced River Ave
- 9929 Merced River Ave
- 16939 Mount Gale Cir
- 9895 Warner Ave
- 9895 Warner Ave
- 9919 Merced River Ave
- 10000 Warner Ave