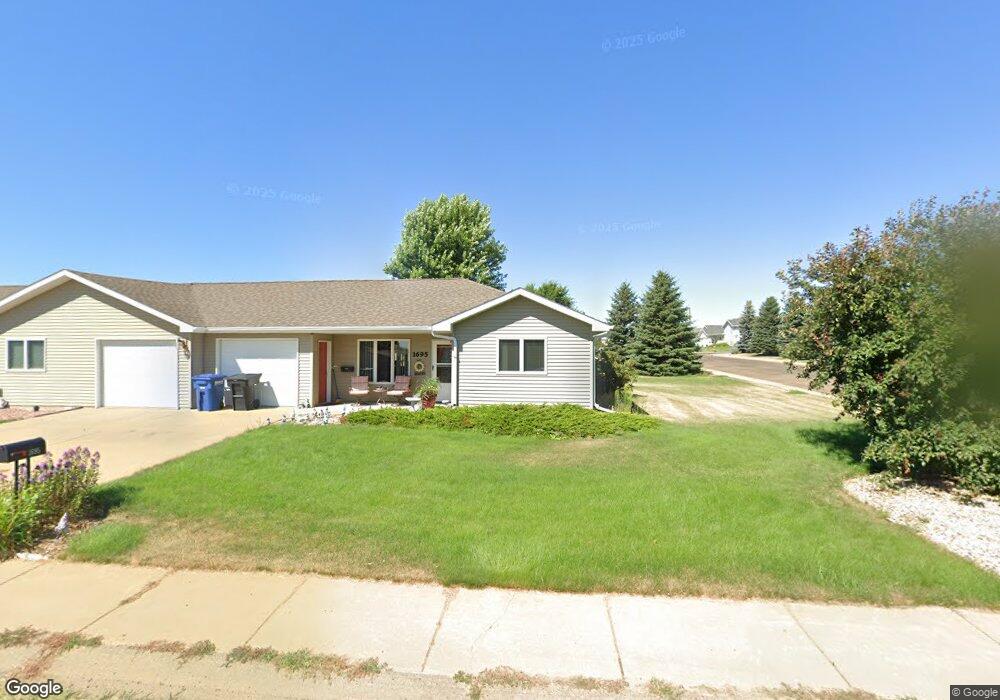
1695 9th Ave E Dickinson, ND 58601
Estimated Value: $277,000 - $377,000
2
Beds
2
Baths
1,209
Sq Ft
$260/Sq Ft
Est. Value
About This Home
This home is located at 1695 9th Ave E, Dickinson, ND 58601 and is currently estimated at $314,002, approximately $259 per square foot. 1695 9th Ave E is a home located in Stark County with nearby schools including Hope Christian Academy and Trinity Elementary School East.
Ownership History
Date
Name
Owned For
Owner Type
Purchase Details
Closed on
Jun 17, 2008
Sold by
Rodne Patricia
Bought by
Rodne Dean and Rodne Wade
Current Estimated Value
Purchase Details
Closed on
Mar 23, 2006
Sold by
Rodne Orville and Rodne Patricia
Bought by
Rodne Dean and Rodne Wade
Purchase Details
Closed on
Sep 15, 2005
Sold by
Mft Realty Llc
Bought by
Rodne Orville T and Rodne Patricia A
Home Financials for this Owner
Home Financials are based on the most recent Mortgage that was taken out on this home.
Original Mortgage
$85,376
Interest Rate
5.93%
Mortgage Type
Future Advance Clause Open End Mortgage
Create a Home Valuation Report for This Property
The Home Valuation Report is an in-depth analysis detailing your home's value as well as a comparison with similar homes in the area
Home Values in the Area
Average Home Value in this Area
Purchase History
| Date | Buyer | Sale Price | Title Company |
|---|---|---|---|
| Rodne Dean | -- | None Available | |
| Rodne Dean | -- | None Available | |
| Rodne Orville T | -- | None Available |
Source: Public Records
Mortgage History
| Date | Status | Borrower | Loan Amount |
|---|---|---|---|
| Previous Owner | Rodne Orville T | $85,376 |
Source: Public Records
Tax History
| Year | Tax Paid | Tax Assessment Tax Assessment Total Assessment is a certain percentage of the fair market value that is determined by local assessors to be the total taxable value of land and additions on the property. | Land | Improvement |
|---|---|---|---|---|
| 2025 | $2,374 | $192,600 | $40,000 | $152,600 |
| 2024 | $2,352 | $192,600 | $40,000 | $152,600 |
| 2023 | $1,900 | $192,600 | $40,000 | $152,600 |
| 2022 | $1,812 | $91,050 | $0 | $0 |
| 2021 | $1,779 | $172,900 | $40,000 | $132,900 |
| 2020 | $1,803 | $172,900 | $40,000 | $132,900 |
| 2019 | $1,808 | $172,900 | $40,000 | $132,900 |
| 2017 | $1,665 | $180,200 | $40,000 | $140,200 |
| 2015 | $1,665 | $190,200 | $40,100 | $150,100 |
| 2014 | $1,763 | $186,400 | $40,100 | $146,300 |
| 2013 | -- | $181,100 | $40,100 | $141,000 |
Source: Public Records
Map
Nearby Homes
Your Personal Tour Guide
Ask me questions while you tour the home.