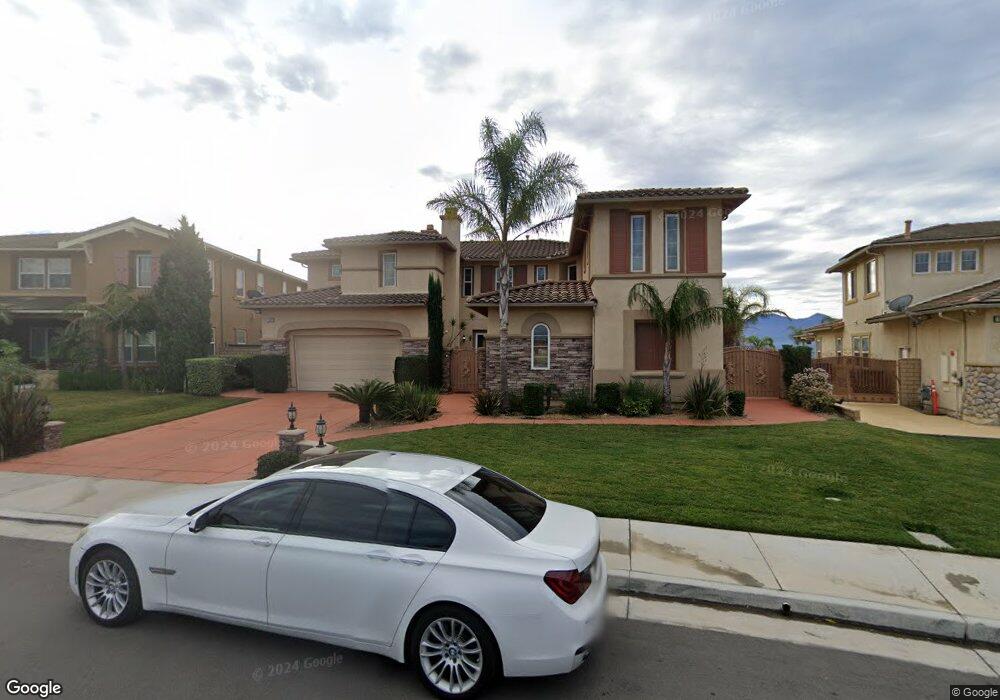
16969 Old Lake Rd Riverside, CA 92503
Lake Hills/Victoria Grove NeighborhoodEstimated Value: $1,160,512 - $1,283,000
4
Beds
4
Baths
5,074
Sq Ft
$239/Sq Ft
Est. Value
About This Home
This home is located at 16969 Old Lake Rd, Riverside, CA 92503 and is currently estimated at $1,213,128, approximately $239 per square foot. 16969 Old Lake Rd is a home located in Riverside County with nearby schools including Lake Hills Elementary School, Ysmael Villegas Middle School, and Hillcrest High School.
Ownership History
Date
Name
Owned For
Owner Type
Purchase Details
Closed on
Aug 25, 2024
Sold by
Patidar Suhas H
Bought by
Patidar Family Trust and Patidar
Current Estimated Value
Purchase Details
Closed on
Oct 19, 2009
Sold by
One West Bank Fsb
Bought by
Patidar Suhas H
Home Financials for this Owner
Home Financials are based on the most recent Mortgage that was taken out on this home.
Original Mortgage
$336,050
Interest Rate
4.99%
Mortgage Type
New Conventional
Purchase Details
Closed on
Mar 16, 2009
Sold by
Hamidi Gul G
Bought by
Indymac Federal Bank Fsb
Purchase Details
Closed on
Jun 20, 2006
Sold by
Lake Hills Riverside Lp
Bought by
Hamidi Gul G
Home Financials for this Owner
Home Financials are based on the most recent Mortgage that was taken out on this home.
Original Mortgage
$741,900
Interest Rate
1%
Mortgage Type
Negative Amortization
Create a Home Valuation Report for This Property
The Home Valuation Report is an in-depth analysis detailing your home's value as well as a comparison with similar homes in the area
Home Values in the Area
Average Home Value in this Area
Purchase History
| Date | Buyer | Sale Price | Title Company |
|---|---|---|---|
| Patidar Family Trust | -- | None Listed On Document | |
| Patidar Suhas H | $517,000 | Chicago Title Company | |
| One West Bank Fsb | -- | Chicago Title Company | |
| Indymac Federal Bank Fsb | $468,151 | None Available | |
| Hamidi Gul G | $989,500 | Landamerica Developer Svcs |
Source: Public Records
Mortgage History
| Date | Status | Borrower | Loan Amount |
|---|---|---|---|
| Previous Owner | Patidar Suhas H | $336,050 | |
| Previous Owner | Hamidi Gul G | $741,900 |
Source: Public Records
Tax History
| Year | Tax Paid | Tax Assessment Tax Assessment Total Assessment is a certain percentage of the fair market value that is determined by local assessors to be the total taxable value of land and additions on the property. | Land | Improvement |
|---|---|---|---|---|
| 2025 | $10,987 | $667,339 | $161,344 | $505,995 |
| 2023 | $10,987 | $641,428 | $155,080 | $486,348 |
| 2022 | $10,776 | $628,852 | $152,040 | $476,812 |
| 2021 | $10,592 | $616,522 | $149,059 | $467,463 |
| 2020 | $10,498 | $610,201 | $147,531 | $462,670 |
| 2019 | $10,407 | $598,238 | $144,639 | $453,599 |
| 2018 | $10,312 | $586,508 | $141,803 | $444,705 |
| 2017 | $10,176 | $575,009 | $139,023 | $435,986 |
| 2016 | $10,184 | $563,736 | $136,298 | $427,438 |
| 2015 | $10,086 | $555,269 | $134,251 | $421,018 |
| 2014 | $10,071 | $544,394 | $131,622 | $412,772 |
Source: Public Records
Map
Nearby Homes
- 17122 Broken Rock Ct
- 16959 Broken Rock Ct
- 16395 Ridge Field Dr
- 0 Summer Springs Way Unit IV25084141
- 0 Summer Springs Way Unit CV25269454
- 16727 Lake Knoll Pkwy
- 17073 Spring Canyon Place
- 17102 Whispering Brook Way
- 11322 Breithorn Ct
- 16180 Angel Canyon Dr
- 1969 Lyon Ave
- 1993 Lyon Ave
- 17401 La Sierra Ave
- 2634 Old Windmill Ct
- 17262 Carrotwood Dr
- 16696 S Peak Ct
- 11135 Old Fashion Way
- 11094 Kayjay St
- 12032 Brianwood Dr
- 17191 Greentree Dr
- 16981 Old Lake Rd
- 16957 Old Lake Rd
- 16993 Old Lake Rd
- 16945 Old Lake Rd
- 16952 Old Lake Rd
- 17005 Old Lake Rd
- 16988 Old Lake Rd
- 16933 Ridge Cliff Dr
- 17017 Old Lake Rd
- 16921 Ridge Cliff Dr
- 18410 Lakepointe Dr
- 18402 Lakepointe Dr
- 18418 Lakepointe Dr
- 16909 Ridge Cliff Dr
- 18426 Lakepointe Dr
- 17029 Old Lake Rd
- 18386 Lakepointe Dr
- 16975 Lakepointe Dr
- 18442 Lakepointe Dr
- 18394 Lakepointe Dr
Your Personal Tour Guide
Ask me questions while you tour the home.