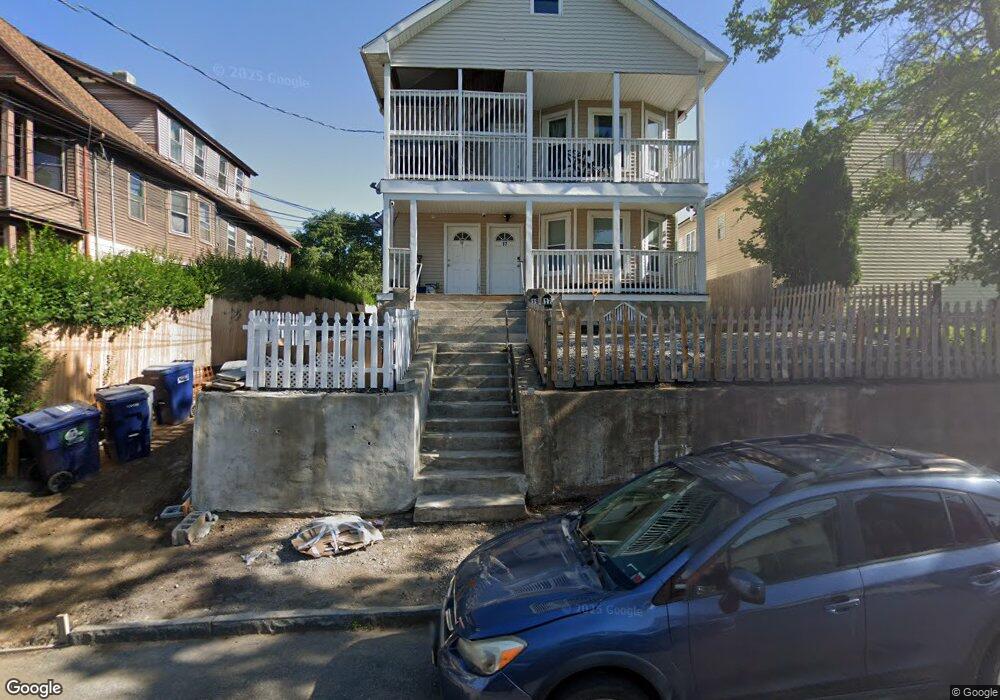
17 6th St Unit 1ST Ansonia, CT 06401
Estimated Value: $331,155 - $446,000
3
Beds
1
Bath
1,000
Sq Ft
$383/Sq Ft
Est. Value
About This Home
This home is located at 17 6th St Unit 1ST, Ansonia, CT 06401 and is currently estimated at $382,789, approximately $382 per square foot. 17 6th St Unit 1ST is a home located in New Haven County with nearby schools including Mead School, Prendergast School, and Ansonia Middle School.
Ownership History
Date
Name
Owned For
Owner Type
Purchase Details
Closed on
Jun 23, 2020
Sold by
1719 Sixth Street Llc
Bought by
Bulabula Mwenze and Mwenze Nzali M
Current Estimated Value
Purchase Details
Closed on
Mar 18, 2009
Sold by
Us Bank Na
Bought by
Marquette Richard C
Purchase Details
Closed on
Feb 2, 2004
Sold by
Dojnia Jodi
Bought by
Nika Katika Z and Mccobe Mark
Home Financials for this Owner
Home Financials are based on the most recent Mortgage that was taken out on this home.
Original Mortgage
$216,804
Interest Rate
5.82%
Mortgage Type
Purchase Money Mortgage
Purchase Details
Closed on
Nov 4, 2002
Sold by
Venable Leigh G
Bought by
Dojnia Jodi
Purchase Details
Closed on
Sep 28, 2000
Sold by
Cook Michael J
Bought by
Venable Leigh G
Purchase Details
Closed on
Aug 2, 1995
Sold by
Bagdonas Mary Est and Cook
Bought by
Cook Michael J
Create a Home Valuation Report for This Property
The Home Valuation Report is an in-depth analysis detailing your home's value as well as a comparison with similar homes in the area
Home Values in the Area
Average Home Value in this Area
Purchase History
| Date | Buyer | Sale Price | Title Company |
|---|---|---|---|
| Bulabula Mwenze | $225,000 | None Available | |
| Marquette Richard C | $70,000 | -- | |
| Nika Katika Z | $240,000 | -- | |
| Dojnia Jodi | $138,300 | -- | |
| Venable Leigh G | $112,000 | -- | |
| Cook Michael J | $80,000 | -- |
Source: Public Records
Mortgage History
| Date | Status | Borrower | Loan Amount |
|---|---|---|---|
| Previous Owner | Cook Michael J | $325,000 | |
| Previous Owner | Cook Michael J | $225,000 | |
| Previous Owner | Cook Michael J | $216,804 |
Source: Public Records
Tax History Compared to Growth
Tax History
| Year | Tax Paid | Tax Assessment Tax Assessment Total Assessment is a certain percentage of the fair market value that is determined by local assessors to be the total taxable value of land and additions on the property. | Land | Improvement |
|---|---|---|---|---|
| 2025 | $9,197 | $144,200 | $37,380 | $106,820 |
| 2024 | $3,820 | $144,200 | $37,380 | $106,820 |
| 2023 | $3,784 | $144,200 | $37,380 | $106,820 |
| 2022 | $4,888 | $129,300 | $35,800 | $93,500 |
| 2021 | $4,888 | $129,300 | $35,800 | $93,500 |
| 2020 | $4,888 | $129,300 | $35,800 | $93,500 |
| 2019 | $4,888 | $129,300 | $35,800 | $93,500 |
| 2018 | $4,825 | $129,300 | $35,800 | $93,500 |
| 2017 | $3,975 | $106,500 | $37,900 | $68,600 |
| 2016 | $3,975 | $106,500 | $37,900 | $68,600 |
| 2015 | $3,996 | $106,500 | $37,900 | $68,600 |
| 2014 | $4,112 | $106,500 | $37,900 | $68,600 |
| 2013 | $4,190 | $106,500 | $37,900 | $68,600 |
Source: Public Records
Map
Nearby Homes
- 19 5th St
- 257 N State St
- 120 N Cliff St
- 222 1/2 N State St
- 44 Woodlawn Ave
- 181 Sunset Dr
- 26 Gardners Ln
- 10 Clarkson St Unit 12
- 13 French St
- 13 Tomlinson St
- 201 Prospect St
- 22 Arch St
- 16 Holbrook Ct
- 193 Wakelee Ave
- 9 Adanti Ave
- 185 Wakelee Ave
- 47 Cottage Ave
- 129 Old Ansonia Rd
- 5 Ansmour Rd
- 40 Grove St