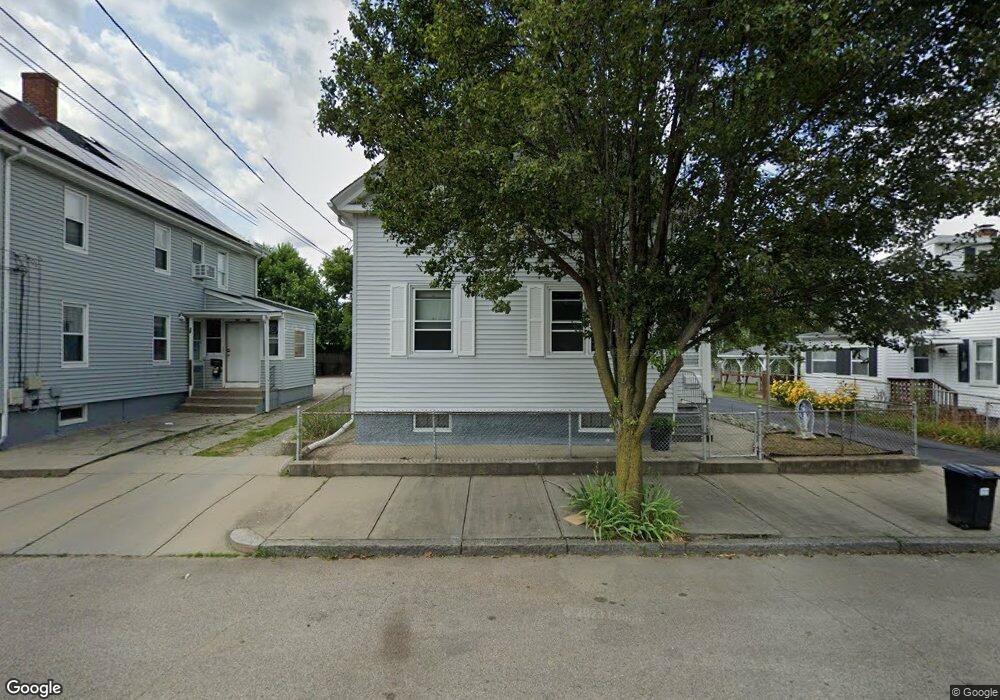
17 Bailey St Cranston, RI 02920
Arlington NeighborhoodEstimated Value: $407,736 - $517,000
4
Beds
2
Baths
1,769
Sq Ft
$260/Sq Ft
Est. Value
About This Home
This home is located at 17 Bailey St, Cranston, RI 02920 and is currently estimated at $459,934, approximately $259 per square foot. 17 Bailey St is a home located in Providence County with nearby schools including Hugh B. Bain Middle School, Cranston High School East, and Achievement First Iluminar Mayoral Academy.
Ownership History
Date
Name
Owned For
Owner Type
Purchase Details
Closed on
Apr 1, 2002
Sold by
Manni Phillip and Stanley Michael
Bought by
Stanley Michael and Stanley Jeannie
Current Estimated Value
Home Financials for this Owner
Home Financials are based on the most recent Mortgage that was taken out on this home.
Original Mortgage
$96,000
Outstanding Balance
$39,594
Interest Rate
6.88%
Estimated Equity
$420,340
Create a Home Valuation Report for This Property
The Home Valuation Report is an in-depth analysis detailing your home's value as well as a comparison with similar homes in the area
Home Values in the Area
Average Home Value in this Area
Purchase History
| Date | Buyer | Sale Price | Title Company |
|---|---|---|---|
| Stanley Michael | $120,000 | -- |
Source: Public Records
Mortgage History
| Date | Status | Borrower | Loan Amount |
|---|---|---|---|
| Open | Stanley Michael | $50,000 | |
| Open | Stanley Michael | $96,000 |
Source: Public Records
Tax History
| Year | Tax Paid | Tax Assessment Tax Assessment Total Assessment is a certain percentage of the fair market value that is determined by local assessors to be the total taxable value of land and additions on the property. | Land | Improvement |
|---|---|---|---|---|
| 2025 | $5,220 | $376,100 | $106,900 | $269,200 |
| 2024 | $5,119 | $376,100 | $106,900 | $269,200 |
| 2023 | $4,389 | $232,200 | $46,900 | $185,300 |
| 2022 | $4,298 | $232,200 | $46,900 | $185,300 |
| 2021 | $4,180 | $232,200 | $46,900 | $185,300 |
| 2020 | $3,847 | $185,200 | $36,900 | $148,300 |
| 2019 | $3,847 | $185,200 | $36,900 | $148,300 |
| 2018 | $3,758 | $185,200 | $36,900 | $148,300 |
| 2017 | $3,221 | $140,400 | $16,800 | $123,600 |
| 2016 | $3,152 | $140,400 | $16,800 | $123,600 |
| 2015 | $3,152 | $140,400 | $16,800 | $123,600 |
| 2014 | $2,924 | $128,000 | $16,800 | $111,200 |
Source: Public Records
Map
Nearby Homes
- 293 Webster Ave
- 79 Priscilla Ave
- 66 Progress Ave
- 19 Dora St
- 283 Waldo St
- 4 Priscilla Ave
- 193 Clarence St
- 108 Roosevelt St
- 44 Puritan St
- 62 Browne St
- 160 Magnolia St
- 69 Sorrento St Unit 71
- 654 Cranston St
- 102 Ellery St
- 70 Rosedale St Unit 1
- 29 Dunford St
- 27 What Cheer Ave
- 17 Judith St
- 15 Judith St
- 11 Hillhurst Ave
Your Personal Tour Guide
Ask me questions while you tour the home.