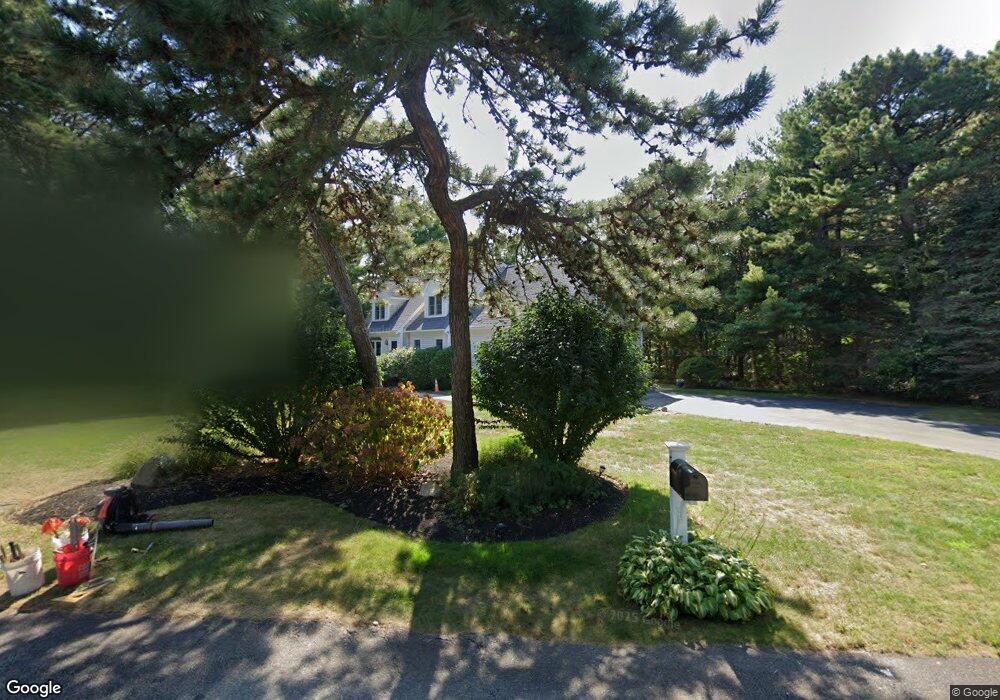
17 Belfast Ln Mashpee, MA 02649
Mashpee Neck NeighborhoodEstimated Value: $771,000 - $905,000
4
Beds
3
Baths
2,201
Sq Ft
$372/Sq Ft
Est. Value
About This Home
This home is located at 17 Belfast Ln, Mashpee, MA 02649 and is currently estimated at $818,305, approximately $371 per square foot. 17 Belfast Ln is a home located in Barnstable County with nearby schools including Kenneth C. Coombs School, Quashnet School, and Mashpee Middle School.
Ownership History
Date
Name
Owned For
Owner Type
Purchase Details
Closed on
Dec 9, 2022
Sold by
Terrill Kevin P and Terrill Colleen E
Bought by
Terrill Nt
Current Estimated Value
Purchase Details
Closed on
Jun 16, 2000
Sold by
Minior Michael E and Minior Maryann
Bought by
Tapper Maryann and Terrill Kevinp
Purchase Details
Closed on
Apr 1, 1999
Sold by
Minior Michael E and Minior Maryann
Bought by
Terrill Kevin P and Terrill Colleen E
Home Financials for this Owner
Home Financials are based on the most recent Mortgage that was taken out on this home.
Original Mortgage
$144,000
Interest Rate
6.78%
Mortgage Type
Purchase Money Mortgage
Purchase Details
Closed on
Mar 31, 1995
Sold by
Prime Prop Rt and Marsters Kenneth E
Bought by
Minior Michael E and Minior Mary Ann
Create a Home Valuation Report for This Property
The Home Valuation Report is an in-depth analysis detailing your home's value as well as a comparison with similar homes in the area
Home Values in the Area
Average Home Value in this Area
Purchase History
| Date | Buyer | Sale Price | Title Company |
|---|---|---|---|
| Terrill Nt | -- | None Available | |
| Tapper Maryann | $180,000 | -- | |
| Terrill Kevin P | $180,000 | -- | |
| Minior Michael E | $160,995 | -- |
Source: Public Records
Mortgage History
| Date | Status | Borrower | Loan Amount |
|---|---|---|---|
| Previous Owner | Minior Michael E | $145,000 | |
| Previous Owner | Minior Michael E | $150,000 | |
| Previous Owner | Minior Michael E | $144,000 | |
| Previous Owner | Minior Michael E | $146,700 |
Source: Public Records
Tax History
| Year | Tax Paid | Tax Assessment Tax Assessment Total Assessment is a certain percentage of the fair market value that is determined by local assessors to be the total taxable value of land and additions on the property. | Land | Improvement |
|---|---|---|---|---|
| 2025 | $4,880 | $737,100 | $285,400 | $451,700 |
| 2024 | $4,437 | $690,100 | $259,500 | $430,600 |
| 2023 | $4,178 | $596,000 | $247,100 | $348,900 |
| 2022 | $4,004 | $490,100 | $200,900 | $289,200 |
| 2021 | $3,908 | $430,900 | $181,000 | $249,900 |
| 2020 | $3,770 | $414,700 | $174,100 | $240,600 |
| 2019 | $3,554 | $392,700 | $174,100 | $218,600 |
| 2018 | $3,388 | $379,800 | $174,100 | $205,700 |
| 2017 | $3,315 | $360,700 | $174,100 | $186,600 |
| 2016 | $3,108 | $336,400 | $160,700 | $175,700 |
| 2015 | $3,119 | $342,400 | $174,100 | $168,300 |
| 2014 | $3,163 | $336,900 | $169,000 | $167,900 |
Source: Public Records
Map
Nearby Homes
- 35 Spinnaker Dr W
- 11 Teal Cir
- 11 Dry Hollow Ln
- 28 Quaker Run Rd
- 353 Simons Narrows Rd
- 183 Simons Narrows Rd
- 640 Poponessett Rd
- 640 Poponessett Rd
- 85 Clamshell Cove Rd
- 34 Rainbow Ln
- 20 Mutiny Way
- 26 Rainbow Ln
- 239 Clamshell Cove Rd
- 29 Musket Ln
- 145 Quinaquisset Ave
- 12 Tracey Rd
- 311 Waquoit Rd
- 6 Willow Cir
- 16 Cedar St
- 114 Orchard Rd
- 25 Belfast Ln
- 11 Belfast Ln
- 38 Camden Ln
- 16 Belfast Ln
- 12 Belfast Ln
- 22 Belfast Ln
- 7 Belfast Ln
- 32 Camden Ln
- 273 Simons Narrows Rd
- 273 Simmons Narrows Rd
- 279 Simons Narrows Rd
- 49 Camden Ln
- 273 Simons Narrows Rd
- 26 Camden Ln
- 267 Simons Narrows Rd
- 54 Camden Ln
- 289 Simons Narrows Rd
- 289 Simons Narrows Rd
- 53 Camden Ln
- 27 Spinnaker Dr W
Your Personal Tour Guide
Ask me questions while you tour the home.