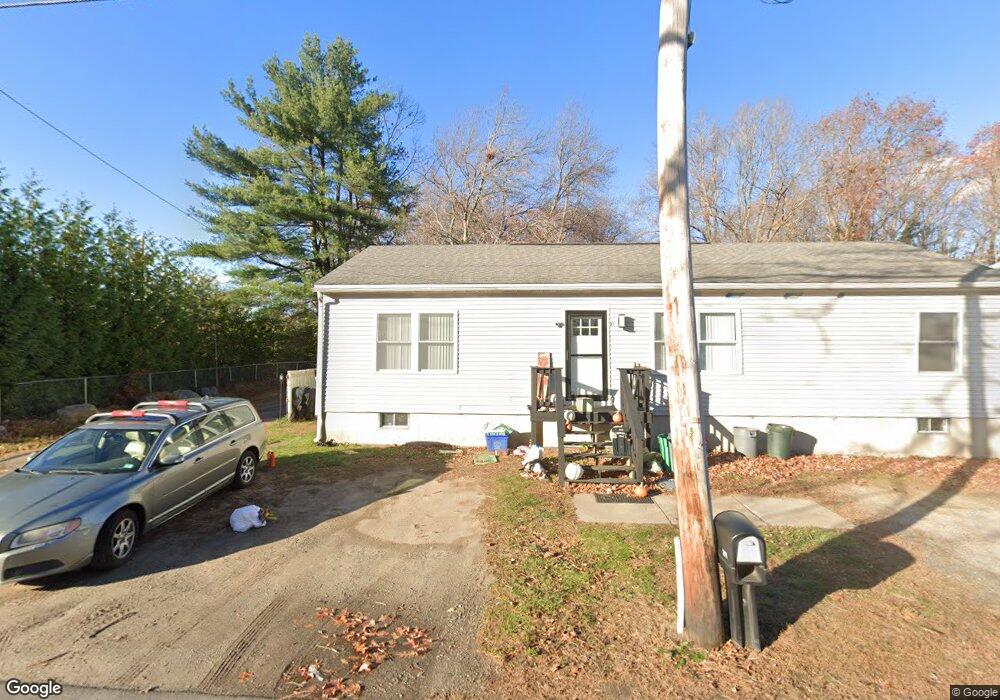
17 Boynton Ln Seabrook, NH 03874
Estimated Value: $403,122 - $506,000
3
Beds
1
Bath
960
Sq Ft
$472/Sq Ft
Est. Value
About This Home
This home is located at 17 Boynton Ln, Seabrook, NH 03874 and is currently estimated at $452,781, approximately $471 per square foot. 17 Boynton Ln is a home located in Rockingham County with nearby schools including Seabrook Elementary School, Seabrook Middle School, and Winnacunnet High School.
Ownership History
Date
Name
Owned For
Owner Type
Purchase Details
Closed on
Nov 1, 2021
Sold by
Kelly Glen E
Bought by
17 Boynton Lane Rt
Current Estimated Value
Purchase Details
Closed on
May 3, 2013
Sold by
Kelly Helga G
Bought by
Kelly Glen E
Purchase Details
Closed on
Jul 7, 2010
Sold by
Bank New York Mellon T
Bought by
Kelly Helga H
Purchase Details
Closed on
Sep 24, 2009
Sold by
Tilley Christopher A and Bank Of New York Mello
Bought by
Bank New York Mellon T
Purchase Details
Closed on
Dec 23, 2004
Sold by
Schwartz Eric
Bought by
Tilley Christopher A and Tilley Shannon M
Home Financials for this Owner
Home Financials are based on the most recent Mortgage that was taken out on this home.
Original Mortgage
$157,150
Interest Rate
5.74%
Mortgage Type
Purchase Money Mortgage
Create a Home Valuation Report for This Property
The Home Valuation Report is an in-depth analysis detailing your home's value as well as a comparison with similar homes in the area
Home Values in the Area
Average Home Value in this Area
Purchase History
| Date | Buyer | Sale Price | Title Company |
|---|---|---|---|
| 17 Boynton Lane Rt | -- | None Available | |
| Kelly Glen E | -- | -- | |
| Kelly Helga H | $94,900 | -- | |
| Bank New York Mellon T | $91,000 | -- | |
| Tilley Christopher A | $224,500 | -- |
Source: Public Records
Mortgage History
| Date | Status | Borrower | Loan Amount |
|---|---|---|---|
| Previous Owner | Tilley Christopher A | $75,000 | |
| Previous Owner | Tilley Christopher A | $157,150 |
Source: Public Records
Tax History Compared to Growth
Tax History
| Year | Tax Paid | Tax Assessment Tax Assessment Total Assessment is a certain percentage of the fair market value that is determined by local assessors to be the total taxable value of land and additions on the property. | Land | Improvement |
|---|---|---|---|---|
| 2024 | $3,959 | $337,800 | $175,600 | $162,200 |
| 2023 | $4,388 | $290,800 | $140,800 | $150,000 |
| 2022 | $3,853 | $290,800 | $140,800 | $150,000 |
| 2021 | $3,993 | $290,800 | $140,800 | $150,000 |
| 2020 | $3,600 | $225,400 | $113,100 | $112,300 |
| 2019 | $3,550 | $225,400 | $113,100 | $112,300 |
| 2018 | $3,495 | $215,100 | $102,800 | $112,300 |
| 2017 | $3,284 | $202,100 | $89,800 | $112,300 |
| 2016 | $2,989 | $202,100 | $89,800 | $112,300 |
| 2015 | $2,764 | $186,900 | $84,300 | $102,600 |
| 2014 | $2,773 | $181,600 | $79,000 | $102,600 |
| 2013 | $2,553 | $167,200 | $79,000 | $88,200 |
Source: Public Records
Map
Nearby Homes
- 20 Railroad Ave
- 22 Farm Ln
- 96 Folly Mill Rd
- 27 Stacey Ave
- 95 Lillian Ave
- 38 Rocks Rd Unit 1
- 1 Marshall Way
- 241 & 245 Lafayette Rd
- 124 Whip-Poor-will St
- 19 Fowlers Ct
- 2 Collins St
- 22 Robert Rd
- 84 S Main St
- 188 Lafayette Rd
- 10 High St
- 46 Kensington Rd
- 207 S Main St
- 17 Riley Rd
- 7 Toll Rd
- 154 Lafayette Rd