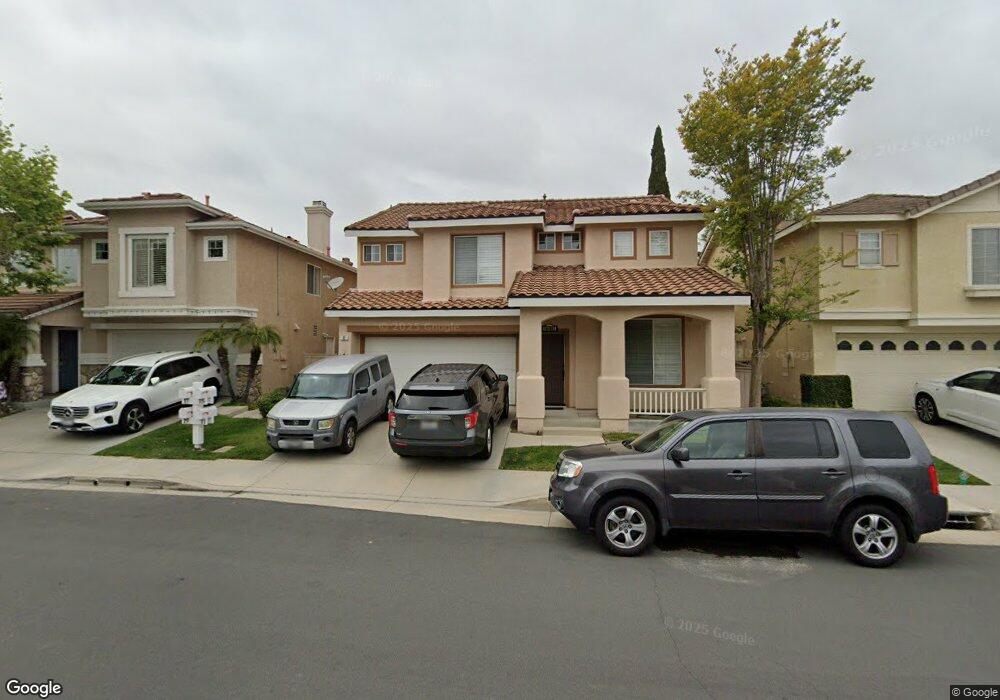
17 Calypso St Aliso Viejo, CA 92656
Estimated Value: $1,445,000 - $1,598,000
5
Beds
3
Baths
2,106
Sq Ft
$721/Sq Ft
Est. Value
About This Home
This home is located at 17 Calypso St, Aliso Viejo, CA 92656 and is currently estimated at $1,517,798, approximately $720 per square foot. 17 Calypso St is a home located in Orange County with nearby schools including Canyon Vista Elementary School, Don Juan Avila Middle School, and Aliso Niguel High School.
Ownership History
Date
Name
Owned For
Owner Type
Purchase Details
Closed on
Jun 23, 2005
Sold by
Dey Ryan and Dey Noelle
Bought by
Dey Ryan A and Dey Noelle K
Current Estimated Value
Purchase Details
Closed on
Nov 25, 2002
Sold by
Boyd Bruce B and Boyd Julia E
Bought by
Dey Ryan and Dey Noelle
Home Financials for this Owner
Home Financials are based on the most recent Mortgage that was taken out on this home.
Original Mortgage
$359,000
Outstanding Balance
$151,876
Interest Rate
6.03%
Estimated Equity
$1,365,922
Purchase Details
Closed on
Jun 11, 1996
Sold by
Kaufman & Broad Coastal Inc
Bought by
Boyd Bruce B and Boyd Julia E
Home Financials for this Owner
Home Financials are based on the most recent Mortgage that was taken out on this home.
Original Mortgage
$205,100
Interest Rate
8.09%
Create a Home Valuation Report for This Property
The Home Valuation Report is an in-depth analysis detailing your home's value as well as a comparison with similar homes in the area
Home Values in the Area
Average Home Value in this Area
Purchase History
| Date | Buyer | Sale Price | Title Company |
|---|---|---|---|
| Dey Ryan A | -- | -- | |
| Dey Ryan | $498,000 | American Title Co | |
| Boyd Bruce B | $216,000 | First American Title Ins Co |
Source: Public Records
Mortgage History
| Date | Status | Borrower | Loan Amount |
|---|---|---|---|
| Open | Dey Ryan | $359,000 | |
| Previous Owner | Boyd Bruce B | $205,100 |
Source: Public Records
Tax History Compared to Growth
Tax History
| Year | Tax Paid | Tax Assessment Tax Assessment Total Assessment is a certain percentage of the fair market value that is determined by local assessors to be the total taxable value of land and additions on the property. | Land | Improvement |
|---|---|---|---|---|
| 2025 | $7,071 | $721,259 | $505,962 | $215,297 |
| 2024 | $7,071 | $707,117 | $496,041 | $211,076 |
| 2023 | $6,907 | $693,252 | $486,314 | $206,938 |
| 2022 | $6,770 | $679,659 | $476,778 | $202,881 |
| 2021 | $6,636 | $666,333 | $467,430 | $198,903 |
| 2020 | $6,568 | $659,501 | $462,637 | $196,864 |
| 2019 | $6,438 | $646,570 | $453,566 | $193,004 |
| 2018 | $6,310 | $633,893 | $444,673 | $189,220 |
| 2017 | $6,185 | $621,464 | $435,954 | $185,510 |
| 2016 | $6,052 | $609,279 | $427,406 | $181,873 |
| 2015 | $6,881 | $600,128 | $420,986 | $179,142 |
| 2014 | $6,737 | $588,373 | $412,740 | $175,633 |
Source: Public Records
Map
Nearby Homes
- 47 Rue du Chateau Unit 26
- 41 Wellington Place
- 30 Trofello Ln Unit 22
- 19 Nopalitos Way
- 17 Nopalitos Way
- 15 Lyon Ridge
- 17 Barcelona Unit 11
- 16 Matisse Cir Unit 87
- 151 Matisse Cir Unit CI68
- 199 Las Flores
- 267 Sandcastle
- 87 Matisse Cir Unit CI42
- 4 Las Flores
- 5 Sherrelwood Ct
- 4 Palatine
- 1 Tularosa Ct
- 8 Veneto Ln
- 22 Wild Rose Place
- 23412 Pacific Park Dr
- 23412 Pacific Park Dr Unit 32E