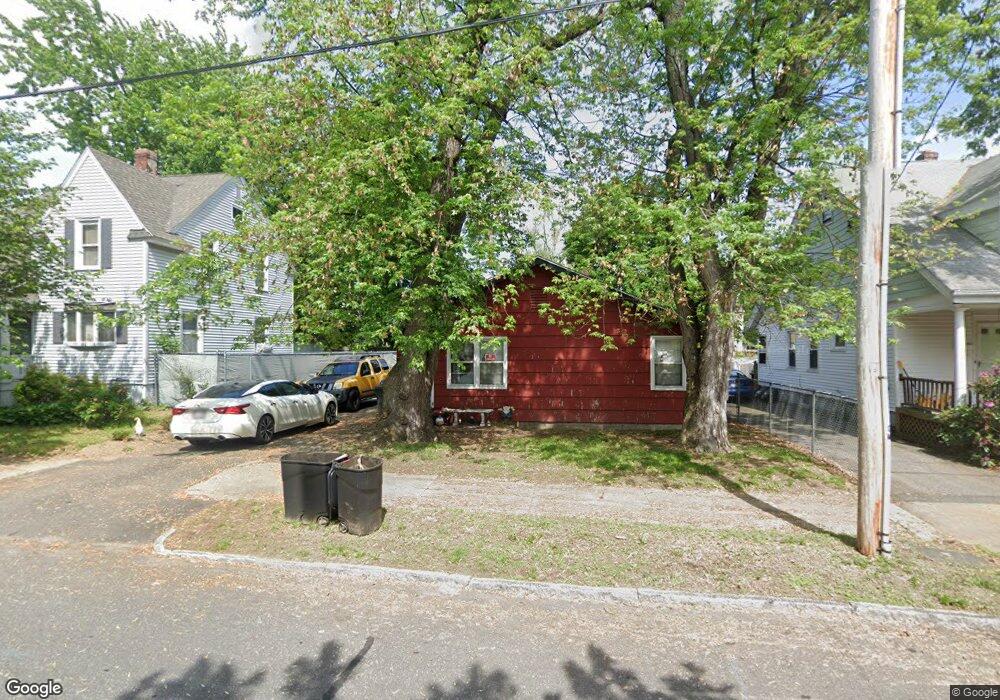
17 Castle St Unit 19 Springfield, MA 01118
East Forest Park NeighborhoodEstimated Value: $250,000 - $294,000
2
Beds
2
Baths
1,134
Sq Ft
$244/Sq Ft
Est. Value
About This Home
This home is located at 17 Castle St Unit 19, Springfield, MA 01118 and is currently estimated at $276,470, approximately $243 per square foot. 17 Castle St Unit 19 is a home located in Hampden County with nearby schools including Frederick Harris Elementary School, M Marcus Kiley Middle, and High School Of Commerce.
Ownership History
Date
Name
Owned For
Owner Type
Purchase Details
Closed on
Dec 5, 2017
Sold by
Connors Elaine A
Bought by
Connors Paul R
Current Estimated Value
Home Financials for this Owner
Home Financials are based on the most recent Mortgage that was taken out on this home.
Original Mortgage
$117,826
Outstanding Balance
$99,648
Interest Rate
3.75%
Mortgage Type
FHA
Estimated Equity
$176,822
Purchase Details
Closed on
Nov 18, 1986
Bought by
Connors Elaine A
Create a Home Valuation Report for This Property
The Home Valuation Report is an in-depth analysis detailing your home's value as well as a comparison with similar homes in the area
Home Values in the Area
Average Home Value in this Area
Purchase History
| Date | Buyer | Sale Price | Title Company |
|---|---|---|---|
| Connors Paul R | $120,000 | -- | |
| Connors Elaine A | -- | -- |
Source: Public Records
Mortgage History
| Date | Status | Borrower | Loan Amount |
|---|---|---|---|
| Open | Connors Paul R | $117,826 |
Source: Public Records
Tax History
| Year | Tax Paid | Tax Assessment Tax Assessment Total Assessment is a certain percentage of the fair market value that is determined by local assessors to be the total taxable value of land and additions on the property. | Land | Improvement |
|---|---|---|---|---|
| 2025 | $2,630 | $167,700 | $36,800 | $130,900 |
| 2024 | $3,029 | $188,600 | $36,800 | $151,800 |
| 2023 | $3,238 | $189,900 | $35,100 | $154,800 |
| 2022 | $3,213 | $170,700 | $35,100 | $135,600 |
| 2021 | $2,877 | $152,200 | $31,900 | $120,300 |
| 2020 | $2,715 | $139,000 | $31,900 | $107,100 |
| 2019 | $2,328 | $118,300 | $31,900 | $86,400 |
| 2018 | $2,170 | $108,300 | $31,900 | $76,400 |
| 2017 | $2,170 | $110,400 | $30,500 | $79,900 |
| 2016 | $2,184 | $111,100 | $30,500 | $80,600 |
| 2015 | $2,061 | $104,800 | $30,500 | $74,300 |
Source: Public Records
Map
Nearby Homes
- 34 Castle St
- 13 Bither St
- 1088 Sumner Ave
- 77 Dorset St
- 161 Dorset St
- 67 Perkins St
- 79 Roosevelt Ave
- 46 Eckington St
- 134 Eddywood St
- 854-856 Sumner Ave
- 88 Brunswick St
- 79 Arvilla St
- 47 Hartford Terrace
- 59 Daviston St
- 170 Plumtree Rd
- 914-916 Belmont Ave
- 70-72 E Alvord St
- 22 Eleanor Rd
- 55 Mandalay Rd
- 410 Allen St
Your Personal Tour Guide
Ask me questions while you tour the home.