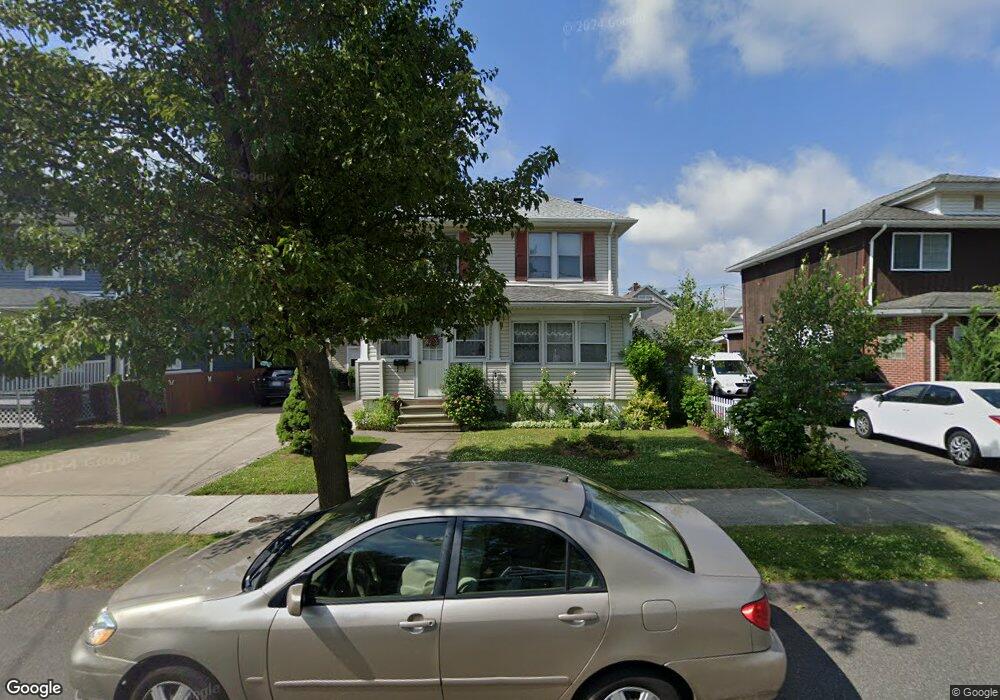
17 Charpentier Blvd Chicopee, MA 01013
Willimansett NeighborhoodEstimated Value: $277,719 - $303,000
3
Beds
1
Bath
1,248
Sq Ft
$233/Sq Ft
Est. Value
About This Home
This home is located at 17 Charpentier Blvd, Chicopee, MA 01013 and is currently estimated at $290,930, approximately $233 per square foot. 17 Charpentier Blvd is a home located in Hampden County with nearby schools including Fairview Elementary School, Bellamy Middle School, and Chicopee High School.
Ownership History
Date
Name
Owned For
Owner Type
Purchase Details
Closed on
Mar 31, 2008
Sold by
Household Finance Corp
Bought by
Kopytyuk Sergey and Kopytyuk Lyubov
Current Estimated Value
Home Financials for this Owner
Home Financials are based on the most recent Mortgage that was taken out on this home.
Original Mortgage
$106,500
Outstanding Balance
$66,721
Interest Rate
5.76%
Mortgage Type
Purchase Money Mortgage
Estimated Equity
$224,209
Purchase Details
Closed on
Mar 8, 2006
Sold by
Household Finance Corp
Bought by
Kopytyuk Sergey and Kopytyuk Lyubov
Home Financials for this Owner
Home Financials are based on the most recent Mortgage that was taken out on this home.
Original Mortgage
$108,000
Interest Rate
6.15%
Mortgage Type
Purchase Money Mortgage
Purchase Details
Closed on
Mar 3, 2006
Sold by
Household Finance Corp
Bought by
Household Finance Corp
Home Financials for this Owner
Home Financials are based on the most recent Mortgage that was taken out on this home.
Original Mortgage
$108,000
Interest Rate
6.15%
Mortgage Type
Purchase Money Mortgage
Create a Home Valuation Report for This Property
The Home Valuation Report is an in-depth analysis detailing your home's value as well as a comparison with similar homes in the area
Home Values in the Area
Average Home Value in this Area
Purchase History
We collect this data history from publicly available records. To have your information removed, we recommend requesting removal directly through your county’s website.
| Date | Buyer | Sale Price | Title Company |
|---|---|---|---|
| Kopytyuk Sergey | $120,000 | -- | |
| Kopytyuk Sergey | $120,000 | -- | |
| Household Finance Corp | $100,000 | -- |
Source: Public Records
Mortgage History
We collect this data history from publicly available records. To have your information removed, we recommend requesting removal directly through your county’s website.
| Date | Status | Borrower | Loan Amount |
|---|---|---|---|
| Open | Kopytyuk Sergey | $106,500 | |
| Previous Owner | Kopytyuk Sergey | $108,000 |
Source: Public Records
Tax History
| Year | Tax Paid | Tax Assessment Tax Assessment Total Assessment is a certain percentage of the fair market value that is determined by local assessors to be the total taxable value of land and additions on the property. | Land | Improvement |
|---|---|---|---|---|
| 2025 | $3,558 | $234,700 | $82,500 | $152,200 |
| 2024 | $3,374 | $228,600 | $80,800 | $147,800 |
| 2023 | $3,166 | $209,000 | $73,500 | $135,500 |
| 2022 | $3,028 | $178,200 | $63,900 | $114,300 |
| 2021 | $2,860 | $162,400 | $58,100 | $104,300 |
| 2020 | $2,719 | $155,700 | $58,100 | $97,600 |
| 2019 | $2,601 | $144,800 | $58,100 | $86,700 |
| 2018 | $2,523 | $137,800 | $55,300 | $82,500 |
| 2017 | $2,465 | $142,400 | $55,300 | $87,100 |
| 2016 | $2,454 | $145,100 | $55,300 | $89,800 |
| 2015 | $2,477 | $141,200 | $55,300 | $85,900 |
| 2014 | $1,238 | $141,200 | $55,300 | $85,900 |
Source: Public Records
Map
Nearby Homes
- 621 Chicopee St
- 92 Walter St
- 94 Cora Ave
- 38 Whitman St
- 958 Main St
- 90 Mckinstry Ave Unit 106
- 5 Vernon St
- 43 Grace St
- 2 Oscar St
- 2143-2145 Northampton St
- 40 Laurel St
- 51 View St
- 800 Mckinstry Ave
- 680 S East St
- 21 Dexter St
- 632 S East St
- 3 Park View Terrace Unit 3
- 60 Chapin St Unit D
- 85-87 Hitchcock St
- 13 Florence St
- 13 Charpentier Blvd
- 23 Charpentier Blvd
- 27 Charpentier Blvd
- 541 Chicopee St
- 20 Thomas St
- 537 Chicopee St
- 31 Charpentier Blvd
- 28 Thomas St
- 38 Thomas St
- 549 Chicopee St
- 24 Charpentier Blvd
- 37 Charpentier Blvd
- 527 Chicopee St
- 44 Thomas St
- 28 Charpentier Blvd
- 553 Chicopee St
- 34 Charpentier Blvd
- 43 Charpentier Blvd
- 21 Thomas St
- 50 Thomas St
Your Personal Tour Guide
Ask me questions while you tour the home.