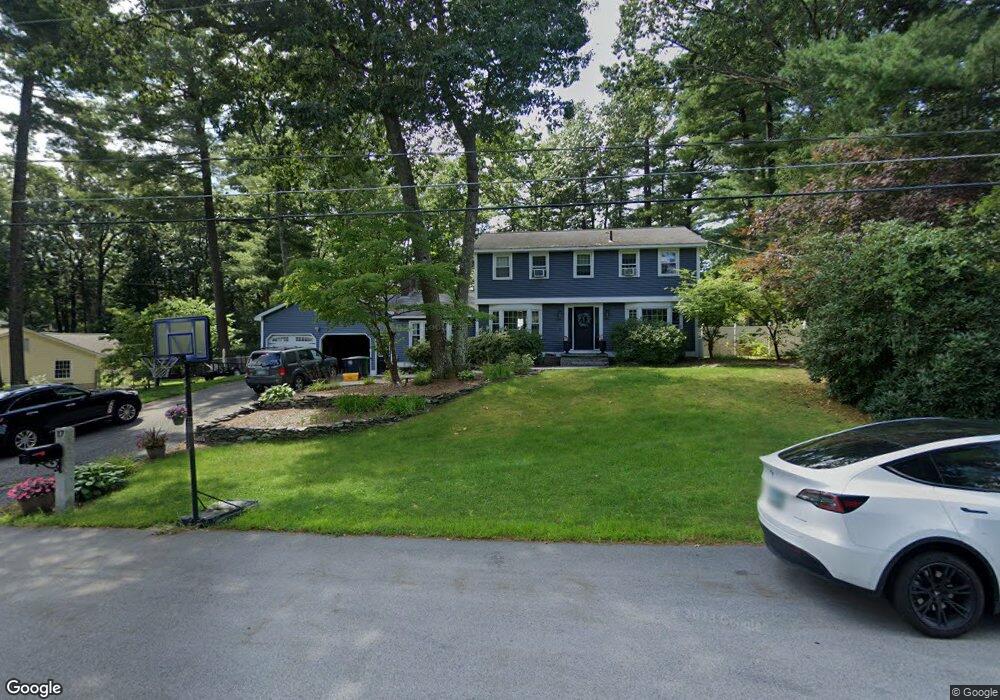
17 Chaucer Rd Nashua, NH 03062
Southwest Nashua NeighborhoodEstimated Value: $634,920 - $762,000
4
Beds
3
Baths
1,988
Sq Ft
$354/Sq Ft
Est. Value
About This Home
This home is located at 17 Chaucer Rd, Nashua, NH 03062 and is currently estimated at $703,730, approximately $353 per square foot. 17 Chaucer Rd is a home located in Hillsborough County with nearby schools including Bicentennial Elementary School, Fairgrounds Middle School, and Nashua High School South.
Ownership History
Date
Name
Owned For
Owner Type
Purchase Details
Closed on
Nov 29, 2006
Sold by
Hoeger Douglas A and Hoeger Merlyn D
Bought by
Friday Kristopher and Friday Kami
Current Estimated Value
Home Financials for this Owner
Home Financials are based on the most recent Mortgage that was taken out on this home.
Original Mortgage
$280,000
Interest Rate
6.36%
Mortgage Type
Purchase Money Mortgage
Purchase Details
Closed on
Oct 5, 2000
Sold by
Edner Timothy J and Edner Heather P
Bought by
Hoeger Douglas A and Hoeger Merlyn D
Home Financials for this Owner
Home Financials are based on the most recent Mortgage that was taken out on this home.
Original Mortgage
$162,500
Interest Rate
7.96%
Purchase Details
Closed on
Aug 30, 1996
Sold by
Clemens Richard M and Clemens Carol A
Bought by
Ebner Timothy J
Create a Home Valuation Report for This Property
The Home Valuation Report is an in-depth analysis detailing your home's value as well as a comparison with similar homes in the area
Home Values in the Area
Average Home Value in this Area
Purchase History
| Date | Buyer | Sale Price | Title Company |
|---|---|---|---|
| Friday Kristopher | $350,000 | -- | |
| Hoeger Douglas A | $262,500 | -- | |
| Ebner Timothy J | $172,000 | -- |
Source: Public Records
Mortgage History
| Date | Status | Borrower | Loan Amount |
|---|---|---|---|
| Open | Ebner Timothy J | $297,000 | |
| Closed | Ebner Timothy J | $278,500 | |
| Closed | Ebner Timothy J | $280,000 | |
| Previous Owner | Ebner Timothy J | $162,500 |
Source: Public Records
Tax History Compared to Growth
Tax History
| Year | Tax Paid | Tax Assessment Tax Assessment Total Assessment is a certain percentage of the fair market value that is determined by local assessors to be the total taxable value of land and additions on the property. | Land | Improvement |
|---|---|---|---|---|
| 2023 | $8,685 | $476,400 | $144,600 | $331,800 |
| 2022 | $8,609 | $476,400 | $144,600 | $331,800 |
| 2021 | $7,802 | $336,000 | $106,000 | $230,000 |
| 2020 | $7,597 | $336,000 | $106,000 | $230,000 |
| 2019 | $7,311 | $336,000 | $106,000 | $230,000 |
| 2018 | $7,127 | $336,000 | $106,000 | $230,000 |
| 2017 | $7,180 | $278,400 | $91,600 | $186,800 |
| 2016 | $6,979 | $278,400 | $91,600 | $186,800 |
| 2015 | $6,829 | $278,400 | $91,600 | $186,800 |
| 2014 | $6,696 | $278,400 | $91,600 | $186,800 |
Source: Public Records
Map
Nearby Homes
- 49 Hawthorne Village Rd Unit U367
- 29 Hawthorne Village Rd Unit U357
- 125 Hawthorne Village Rd Unit U404
- 10 Lamb Rd
- 97 Hawthorne Village Rd Unit U390
- 10 Shelley Dr
- H2 Black Oak Dr Unit 2
- 10 Mountain Laurels Dr Unit 607
- 98 Peele Rd
- 16 Mountain Laurels Dr Unit 402
- 18 Vieckis Dr
- 2 Belgian Place
- 2 Snow Cir Unit P2
- 16 Emerson Rd
- 27 New Searles Rd
- 113 Bluestone Dr
- 51 Legacy Dr
- 1 Kenmare Rd Unit 306
- 19 Georgetown Dr
- 49 New Searles Rd