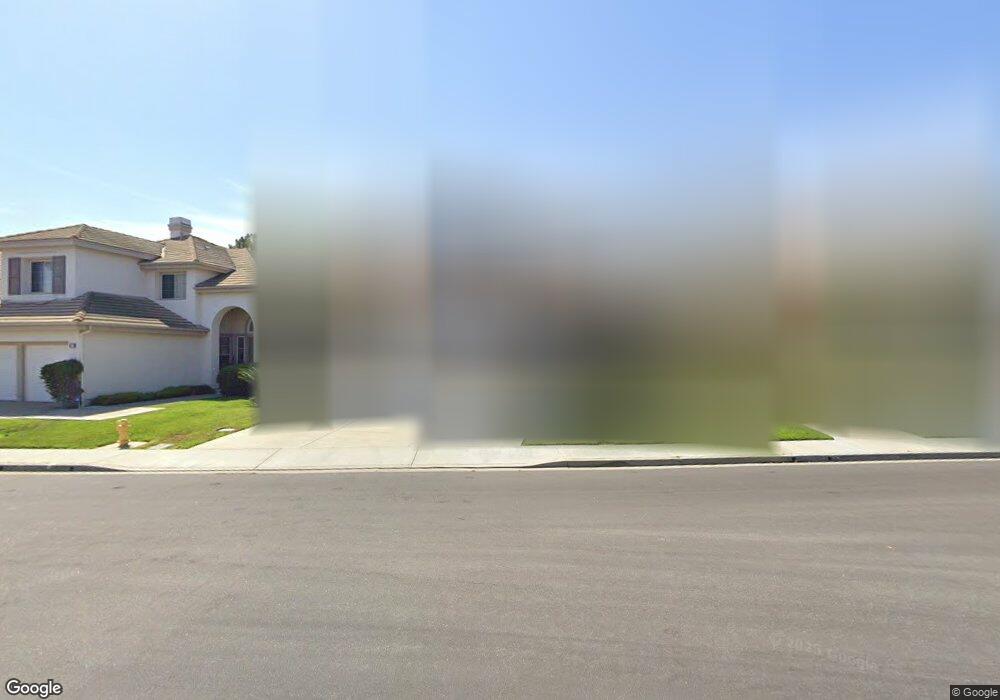
17 Cipriani Irvine, CA 92606
Westpark NeighborhoodEstimated Value: $1,977,000 - $2,388,000
5
Beds
3
Baths
2,444
Sq Ft
$893/Sq Ft
Est. Value
About This Home
This home is located at 17 Cipriani, Irvine, CA 92606 and is currently estimated at $2,182,130, approximately $892 per square foot. 17 Cipriani is a home located in Orange County with nearby schools including Plaza Vista K-8 School, Lakeside Middle School, and Irvine High School.
Ownership History
Date
Name
Owned For
Owner Type
Purchase Details
Closed on
Apr 14, 2000
Sold by
Yuen Yau Ching
Bought by
Nghiem Loan Thi Phuong and Loan Thi Phuong Nghiem Revocable Living
Current Estimated Value
Home Financials for this Owner
Home Financials are based on the most recent Mortgage that was taken out on this home.
Original Mortgage
$120,000
Outstanding Balance
$41,082
Interest Rate
8.22%
Estimated Equity
$2,141,048
Purchase Details
Closed on
May 8, 1997
Sold by
Yau Polly C
Bought by
Yau Ching Yuen
Home Financials for this Owner
Home Financials are based on the most recent Mortgage that was taken out on this home.
Original Mortgage
$316,000
Interest Rate
8.15%
Purchase Details
Closed on
May 1, 1997
Sold by
Standard Pacific Corp
Bought by
Yau Ching Yuen
Home Financials for this Owner
Home Financials are based on the most recent Mortgage that was taken out on this home.
Original Mortgage
$316,000
Interest Rate
8.15%
Create a Home Valuation Report for This Property
The Home Valuation Report is an in-depth analysis detailing your home's value as well as a comparison with similar homes in the area
Home Values in the Area
Average Home Value in this Area
Purchase History
| Date | Buyer | Sale Price | Title Company |
|---|---|---|---|
| Nghiem Loan Thi Phuong | $535,000 | -- | |
| Yau Ching Yuen | -- | -- | |
| Yau Ching Yuen | $395,000 | First American Title Ins Co |
Source: Public Records
Mortgage History
| Date | Status | Borrower | Loan Amount |
|---|---|---|---|
| Open | Nghiem Loan Thi Phuong | $120,000 | |
| Previous Owner | Yau Ching Yuen | $316,000 |
Source: Public Records
Tax History
| Year | Tax Paid | Tax Assessment Tax Assessment Total Assessment is a certain percentage of the fair market value that is determined by local assessors to be the total taxable value of land and additions on the property. | Land | Improvement |
|---|---|---|---|---|
| 2025 | $8,605 | $822,280 | $424,245 | $398,035 |
| 2024 | $8,605 | $806,157 | $415,926 | $390,231 |
| 2023 | $8,382 | $790,350 | $407,770 | $382,580 |
| 2022 | $8,222 | $774,853 | $399,774 | $375,079 |
| 2021 | $8,034 | $759,660 | $391,935 | $367,725 |
| 2020 | $7,988 | $751,871 | $387,916 | $363,955 |
| 2019 | $8,495 | $737,129 | $380,310 | $356,819 |
| 2018 | $8,357 | $722,676 | $372,853 | $349,823 |
| 2017 | $8,307 | $708,506 | $365,542 | $342,964 |
| 2016 | $8,235 | $694,614 | $358,374 | $336,240 |
| 2015 | $8,081 | $684,181 | $352,991 | $331,190 |
| 2014 | $7,979 | $670,779 | $346,076 | $324,703 |
Source: Public Records
Map
Nearby Homes
- 16 Sovente
- 11 Pienza
- 26 Morning Dove
- 1470 Voyager Dr
- 16626 Mosscreek St
- 802 Marinella Aisle
- 8 Sandpiper
- 15 Woodrush
- 390 Deerfield Ave Unit 125
- 3229 Larkspur St
- 800 Solvay Aisle
- 12 La Ronda
- 902 Solvay Aisle Unit 141
- 24 Millstone Unit 137
- 1703 Solvay Aisle Unit 106
- 328 Flyers Ln
- 38 Wetstone
- 374 Aviator Ln
- 279 Barnes Rd
- 280 Tustin Field Dr
Your Personal Tour Guide
Ask me questions while you tour the home.