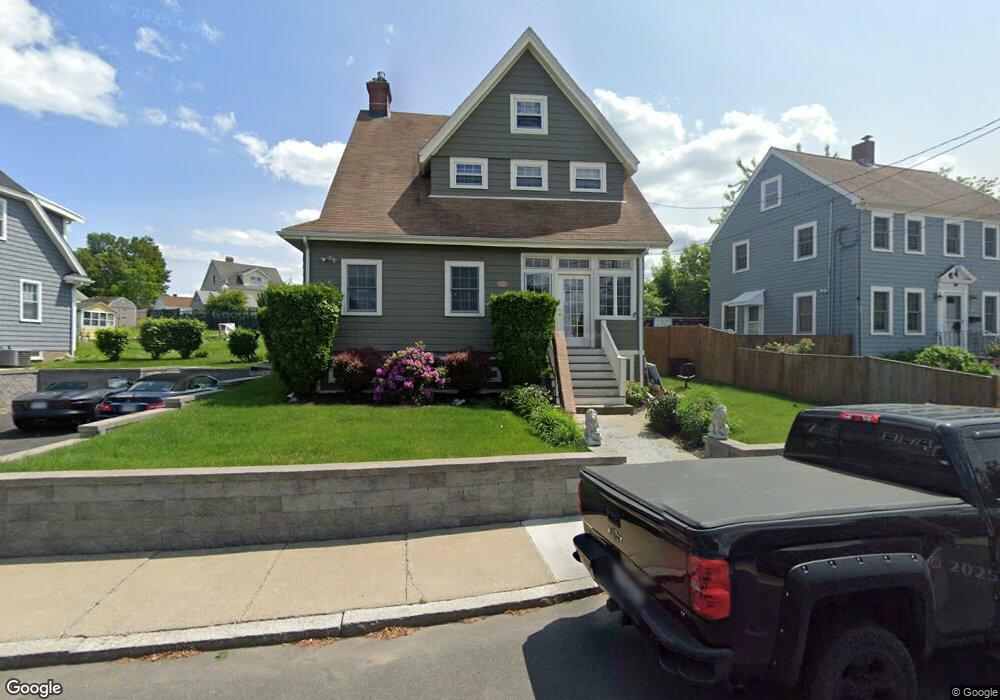
17 Cliff Ave Winthrop, MA 02152
Winthrop Highlands NeighborhoodEstimated Value: $1,015,000 - $1,162,000
4
Beds
2
Baths
2,704
Sq Ft
$395/Sq Ft
Est. Value
About This Home
This home is located at 17 Cliff Ave, Winthrop, MA 02152 and is currently estimated at $1,067,619, approximately $394 per square foot. 17 Cliff Ave is a home located in Suffolk County with nearby schools including William P. Gorman/Fort Banks Elementary School, Arthur T. Cummings Elementary School, and Winthrop Middle School.
Ownership History
Date
Name
Owned For
Owner Type
Purchase Details
Closed on
Jul 30, 2013
Sold by
Fucillo Anthony C
Bought by
Anthony C Fucillo T
Current Estimated Value
Purchase Details
Closed on
Feb 26, 2010
Sold by
Young Deborah A and Young Christopher J
Bought by
Fucillo Anthony C
Home Financials for this Owner
Home Financials are based on the most recent Mortgage that was taken out on this home.
Original Mortgage
$43,525
Interest Rate
5.02%
Purchase Details
Closed on
Jul 11, 2007
Sold by
Young Deborah A
Bought by
Young Christopher J and Young Deborah A
Purchase Details
Closed on
Aug 31, 1998
Sold by
Diamond Kenneth
Bought by
Young Deborah A
Create a Home Valuation Report for This Property
The Home Valuation Report is an in-depth analysis detailing your home's value as well as a comparison with similar homes in the area
Home Values in the Area
Average Home Value in this Area
Purchase History
| Date | Buyer | Sale Price | Title Company |
|---|---|---|---|
| Anthony C Fucillo T | -- | -- | |
| Fucillo Anthony C | $435,250 | -- | |
| Young Christopher J | -- | -- | |
| Young Deborah A | $190,000 | -- |
Source: Public Records
Mortgage History
| Date | Status | Borrower | Loan Amount |
|---|---|---|---|
| Previous Owner | Young Deborah A | $43,525 | |
| Previous Owner | Fucillo Anthony C | $348,200 | |
| Previous Owner | Young Deborah A | $175,000 | |
| Previous Owner | Young Deborah A | $163,000 |
Source: Public Records
Tax History
| Year | Tax Paid | Tax Assessment Tax Assessment Total Assessment is a certain percentage of the fair market value that is determined by local assessors to be the total taxable value of land and additions on the property. | Land | Improvement |
|---|---|---|---|---|
| 2025 | $9,575 | $927,800 | $492,900 | $434,900 |
| 2024 | $9,136 | $876,800 | $494,300 | $382,500 |
| 2023 | $9,864 | $921,900 | $492,300 | $429,600 |
| 2022 | $9,998 | $850,200 | $465,000 | $385,200 |
| 2021 | $9,745 | $768,500 | $415,300 | $353,200 |
| 2020 | $9,543 | $756,200 | $415,300 | $340,900 |
| 2019 | $9,342 | $708,800 | $382,700 | $326,100 |
| 2018 | $8,472 | $598,300 | $292,000 | $306,300 |
| 2017 | $7,815 | $542,300 | $265,600 | $276,700 |
| 2016 | $7,385 | $480,500 | $230,900 | $249,600 |
| 2015 | $6,582 | $459,000 | $224,200 | $234,800 |
| 2014 | $6,070 | $389,600 | $186,800 | $202,800 |
Source: Public Records
Map
Nearby Homes
- 22 Upland Rd
- 47 Highland Ave
- 43 Sagamore Ave Unit 1
- 201 Cliff Ave
- 3 Seal Harbor Rd Unit 344
- 3 Seal Harbor Rd Unit 133
- 1 Seal Harbor Rd Unit 210
- 1 Seal Harbor Rd Unit 701
- 800 Governors Dr Unit 6
- 100 Governors Dr Unit 118
- 140 Shirley St Unit 201
- 140 Shirley St Unit 309
- 140 Shirley St Unit 310
- 140 Shirley St Unit 204
- 130 Shirley St Unit 202
- 441 Winthrop St
- 50-52 Wilshire St
- 426 Winthrop St
- 1000 Winthrop Ave Unit 2
- 203 Winthrop Shore Dr Unit 2
Your Personal Tour Guide
Ask me questions while you tour the home.