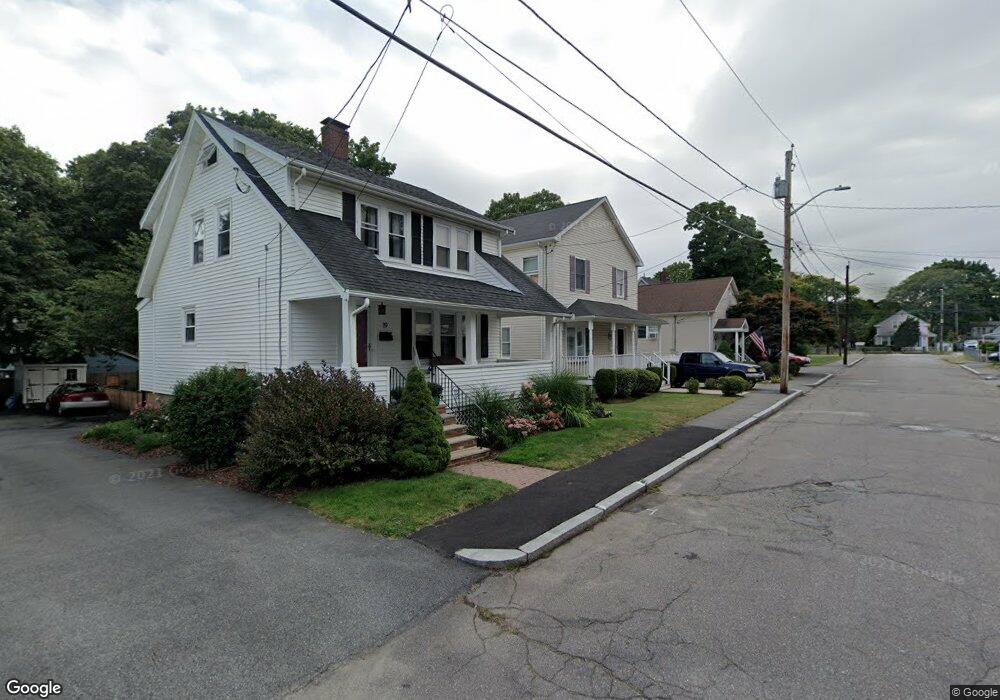
17 Cliff St Malden, MA 02148
Forestdale NeighborhoodEstimated Value: $749,000 - $935,000
4
Beds
4
Baths
2,240
Sq Ft
$383/Sq Ft
Est. Value
About This Home
This home is located at 17 Cliff St, Malden, MA 02148 and is currently estimated at $857,618, approximately $382 per square foot. 17 Cliff St is a home located in Middlesex County with nearby schools including Malden High School, Cheverus Centennial School, and Malden Catholic.
Ownership History
Date
Name
Owned For
Owner Type
Purchase Details
Closed on
Feb 21, 2001
Sold by
Pjrm Inc
Bought by
Gordon Stephen W and Gordon Mariann
Current Estimated Value
Home Financials for this Owner
Home Financials are based on the most recent Mortgage that was taken out on this home.
Original Mortgage
$80,000
Interest Rate
6.89%
Mortgage Type
Purchase Money Mortgage
Purchase Details
Closed on
Aug 24, 2000
Sold by
Middleton Anne
Bought by
Pjrm Inc
Home Financials for this Owner
Home Financials are based on the most recent Mortgage that was taken out on this home.
Original Mortgage
$303,000
Interest Rate
8.06%
Mortgage Type
Purchase Money Mortgage
Create a Home Valuation Report for This Property
The Home Valuation Report is an in-depth analysis detailing your home's value as well as a comparison with similar homes in the area
Home Values in the Area
Average Home Value in this Area
Purchase History
| Date | Buyer | Sale Price | Title Company |
|---|---|---|---|
| Gordon Stephen W | $299,500 | -- | |
| Pjrm Inc | $183,000 | -- |
Source: Public Records
Mortgage History
| Date | Status | Borrower | Loan Amount |
|---|---|---|---|
| Open | Pjrm Inc | $145,000 | |
| Closed | Pjrm Inc | $20,000 | |
| Closed | Pjrm Inc | $80,000 | |
| Previous Owner | Pjrm Inc | $303,000 |
Source: Public Records
Tax History
| Year | Tax Paid | Tax Assessment Tax Assessment Total Assessment is a certain percentage of the fair market value that is determined by local assessors to be the total taxable value of land and additions on the property. | Land | Improvement |
|---|---|---|---|---|
| 2025 | $88 | $779,700 | $305,300 | $474,400 |
| 2024 | $8,255 | $706,200 | $288,800 | $417,400 |
| 2023 | $8,182 | $671,200 | $264,000 | $407,200 |
| 2022 | $7,511 | $608,200 | $239,300 | $368,900 |
| 2021 | $7,088 | $576,700 | $218,600 | $358,100 |
| 2020 | $6,989 | $552,500 | $207,900 | $344,600 |
| 2019 | $6,837 | $515,200 | $198,000 | $317,200 |
| 2018 | $6,636 | $471,000 | $167,100 | $303,900 |
| 2017 | $6,453 | $455,400 | $167,100 | $288,300 |
| 2016 | $6,202 | $409,100 | $158,800 | $250,300 |
| 2015 | $6,009 | $382,000 | $149,700 | $232,300 |
| 2014 | $5,785 | $359,300 | $136,100 | $223,200 |
Source: Public Records
Map
Nearby Homes
- 16 Willard St
- 42-44 Columbia St
- 11 Havelock St
- 55 Bowman St
- 44-46 Myrtle St
- 70-72 Bainbridge St
- 31 Preston St
- 48 Summit St
- 557 Salem St Unit 3
- 557 Salem St Unit 4
- 177 Cherry St
- 101 Waite St Unit B5
- 59 Dexter Rd
- 0 S Mountain Avenue & O Cargil
- 43 Granville Ave
- 10 Dell St
- 124 Floral Ave
- 82 Elwell St
- 31 Temple St
- 56 Rocky Nook Unit 56
Your Personal Tour Guide
Ask me questions while you tour the home.