Estimated Value: $419,000 - $451,000
3
Beds
2
Baths
1,611
Sq Ft
$271/Sq Ft
Est. Value
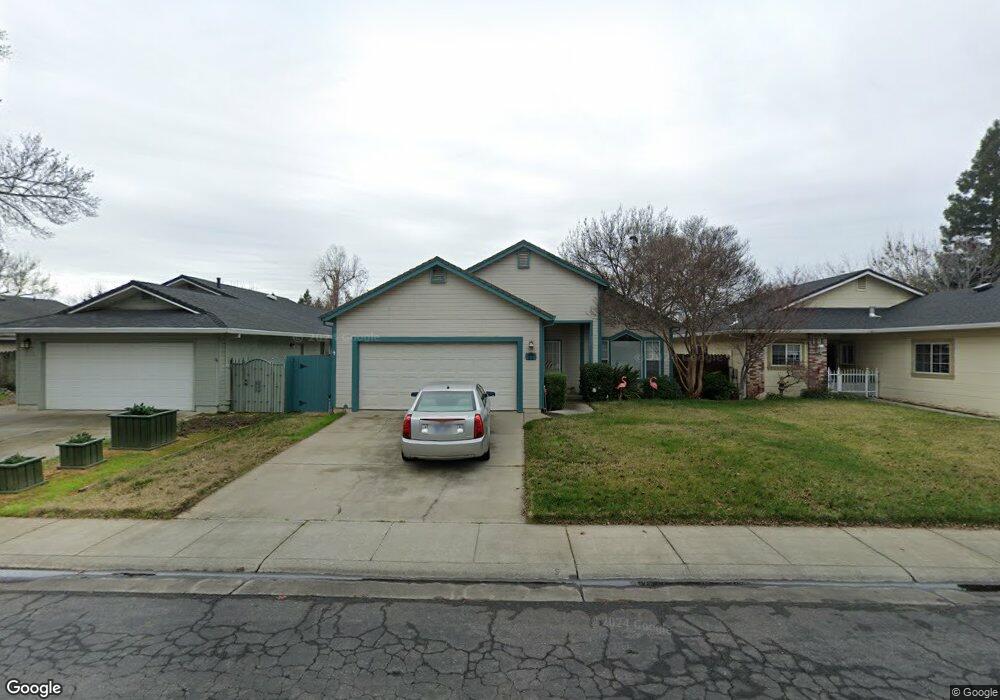
About This Home
This home is located at 17 Coleman Ct, Chico, CA 95926 and is currently estimated at $436,679, approximately $271 per square foot. 17 Coleman Ct is a home located in Butte County with nearby schools including Marigold Elementary School, Bidwell Junior High School, and Pleasant Valley High School.
Ownership History
Date
Name
Owned For
Owner Type
Purchase Details
Closed on
Apr 16, 2014
Sold by
Rutherford Bridget and Dorothy Wiley Trust
Bought by
Fales John and Fales Donna
Current Estimated Value
Home Financials for this Owner
Home Financials are based on the most recent Mortgage that was taken out on this home.
Original Mortgage
$125,000
Outstanding Balance
$94,808
Interest Rate
4.28%
Mortgage Type
New Conventional
Estimated Equity
$341,871
Purchase Details
Closed on
Oct 8, 2003
Sold by
Wiley Dorothy G and Dorothy Wiley Trust
Bought by
Wiley Dorothy G and Dorothy Wiley Trust
Create a Home Valuation Report for This Property
The Home Valuation Report is an in-depth analysis detailing your home's value as well as a comparison with similar homes in the area
Purchase History
| Date | Buyer | Sale Price | Title Company |
|---|---|---|---|
| Fales John | $261,000 | Mid Valley Title & Escrow Co | |
| Wiley Dorothy G | -- | -- |
Source: Public Records
Mortgage History
| Date | Status | Borrower | Loan Amount |
|---|---|---|---|
| Open | Fales John | $125,000 |
Source: Public Records
Tax History
| Year | Tax Paid | Tax Assessment Tax Assessment Total Assessment is a certain percentage of the fair market value that is determined by local assessors to be the total taxable value of land and additions on the property. | Land | Improvement |
|---|---|---|---|---|
| 2025 | $3,396 | $319,939 | $128,710 | $191,229 |
| 2024 | $3,396 | $313,667 | $126,187 | $187,480 |
| 2023 | $3,354 | $307,517 | $123,713 | $183,804 |
| 2022 | $3,298 | $301,488 | $121,288 | $180,200 |
| 2021 | $3,235 | $295,577 | $118,910 | $176,667 |
| 2020 | $3,225 | $292,547 | $117,691 | $174,856 |
| 2019 | $3,165 | $286,812 | $115,384 | $171,428 |
| 2018 | $3,106 | $281,189 | $113,122 | $168,067 |
| 2017 | $3,041 | $275,676 | $110,904 | $164,772 |
| 2016 | $2,774 | $270,272 | $108,730 | $161,542 |
| 2015 | $2,773 | $266,213 | $107,097 | $159,116 |
| 2014 | $2,094 | $203,459 | $58,910 | $144,549 |
Source: Public Records
Map
Nearby Homes
- 3 Sunflower Ct
- 1291 East Ave
- 1261 Parque Dr
- 1280 Calla Ln
- 50 Casa Del Rey Ct
- 9 Gazania Ct
- 2556 Mariposa Ave
- 1280 Dale Way
- 15 La Casa Ct
- 12 Lakewood Way
- 16 Tierra Rosa Ln
- 19 Via Verona Cir
- 4 Lakewood Way
- 34 Garden Park Dr
- 9 Trieste Way
- 1094 Manzanita Ave
- 5 Glenshire Ln
- 2840 Swallowtail Way
- 5 Canterbury Cir
- 75 Cottage Ave
Your Personal Tour Guide
Ask me questions while you tour the home.