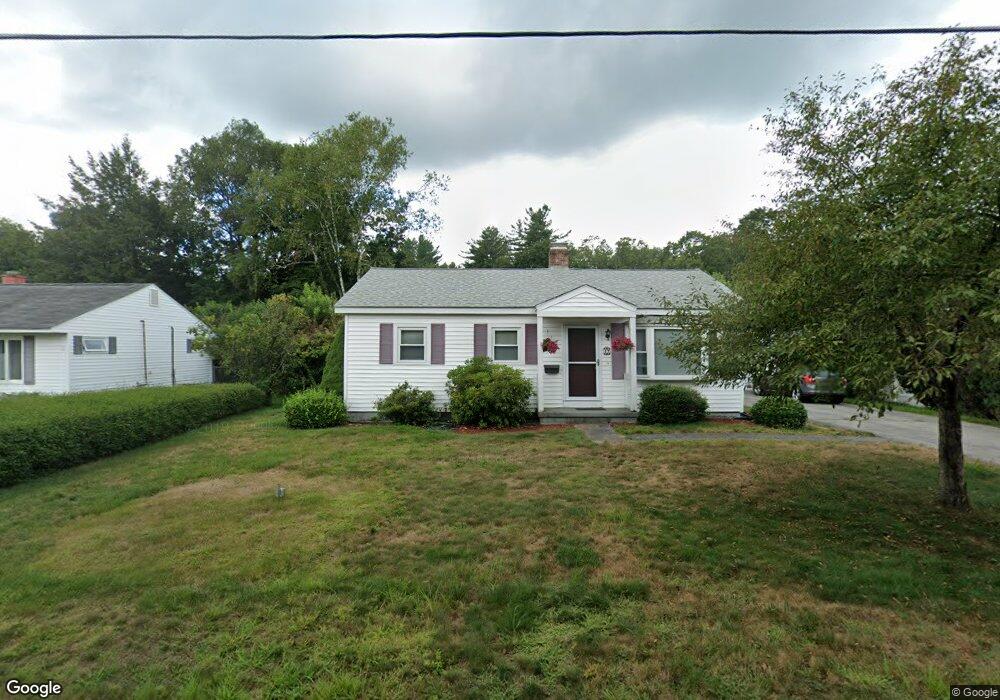
17 Conant Dr Concord, NH 03301
South End NeighborhoodEstimated Value: $352,000 - $426,937
2
Beds
2
Baths
875
Sq Ft
$449/Sq Ft
Est. Value
About This Home
This home is located at 17 Conant Dr, Concord, NH 03301 and is currently estimated at $392,984, approximately $449 per square foot. 17 Conant Dr is a home located in Merrimack County with nearby schools including Abbot-Downing School, Rundlett Middle School, and Concord High School.
Ownership History
Date
Name
Owned For
Owner Type
Purchase Details
Closed on
Nov 22, 2013
Sold by
Heifetz Steven R and Heifetz Christine M
Bought by
Steven R Heifetz T R and Steven Heifetz
Current Estimated Value
Purchase Details
Closed on
Dec 27, 1999
Sold by
Kielwein Ginger L
Bought by
Heifetz Steven R and Heifetz Christine M
Home Financials for this Owner
Home Financials are based on the most recent Mortgage that was taken out on this home.
Original Mortgage
$110,000
Interest Rate
7.61%
Mortgage Type
Purchase Money Mortgage
Purchase Details
Closed on
Jul 26, 1996
Sold by
Hart Richard C and Hart Dorothy M
Bought by
Kielwein Ginger L
Home Financials for this Owner
Home Financials are based on the most recent Mortgage that was taken out on this home.
Original Mortgage
$61,750
Interest Rate
8.37%
Mortgage Type
Purchase Money Mortgage
Create a Home Valuation Report for This Property
The Home Valuation Report is an in-depth analysis detailing your home's value as well as a comparison with similar homes in the area
Home Values in the Area
Average Home Value in this Area
Purchase History
| Date | Buyer | Sale Price | Title Company |
|---|---|---|---|
| Steven R Heifetz T R | -- | -- | |
| Heifetz Steven R | $138,000 | -- | |
| Kielwein Ginger L | $77,200 | -- |
Source: Public Records
Mortgage History
| Date | Status | Borrower | Loan Amount |
|---|---|---|---|
| Previous Owner | Kielwein Ginger L | $110,000 | |
| Previous Owner | Kielwein Ginger L | $61,750 |
Source: Public Records
Tax History
| Year | Tax Paid | Tax Assessment Tax Assessment Total Assessment is a certain percentage of the fair market value that is determined by local assessors to be the total taxable value of land and additions on the property. | Land | Improvement |
|---|---|---|---|---|
| 2025 | $8,087 | $277,800 | $109,700 | $168,100 |
| 2024 | $7,911 | $285,700 | $109,700 | $176,000 |
| 2023 | $7,674 | $285,700 | $109,700 | $176,000 |
| 2022 | $7,397 | $285,700 | $109,700 | $176,000 |
| 2021 | $7,177 | $285,700 | $109,700 | $176,000 |
| 2020 | $6,693 | $250,100 | $87,600 | $162,500 |
| 2019 | $6,150 | $221,400 | $85,900 | $135,500 |
| 2018 | $6,129 | $217,400 | $85,900 | $131,500 |
| 2017 | $5,922 | $209,700 | $85,900 | $123,800 |
| 2016 | $5,581 | $201,700 | $84,300 | $117,400 |
| 2015 | $5,290 | $187,400 | $87,900 | $99,500 |
| 2014 | $5,024 | $187,400 | $87,900 | $99,500 |
| 2013 | -- | $184,700 | $87,900 | $96,800 |
| 2012 | -- | $178,000 | $87,900 | $90,100 |
Source: Public Records
Map
Nearby Homes
- 0 South St Unit 4969509
- 47 Noyes St
- 335 S Main St
- 40 Nivelle St
- 47 South St
- 289 South St
- 58 S State St
- 7-9 Myrtle St
- 25 N Spring St
- 24 Hazel Dr
- 30 Longmeadow Dr
- 22 Fairfield Dr
- 21 Fairfield Dr
- 20 Fairfield Dr
- 5 Holly Cir
- 5 Windchime Dr
- 19 Grappone Dr
- 30 Penacook St
- 28 Stevens Dr
- 4 Bow Center Rd Unit F2
Your Personal Tour Guide
Ask me questions while you tour the home.