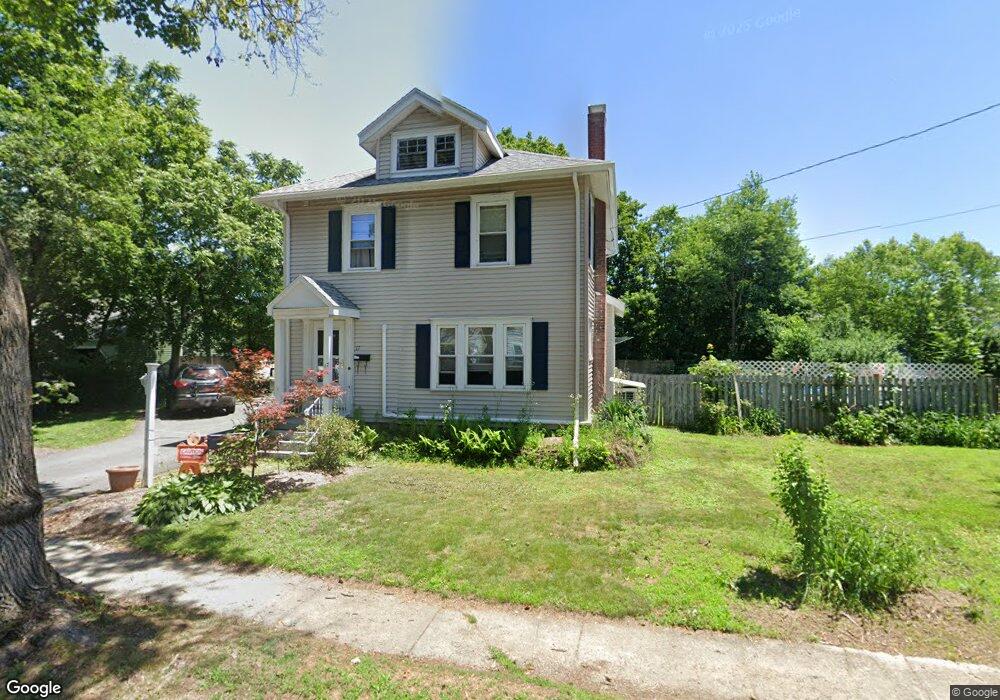
17 Dunnell Rd Greenfield, MA 01301
Estimated Value: $363,000 - $391,000
3
Beds
2
Baths
1,602
Sq Ft
$234/Sq Ft
Est. Value
About This Home
This home is located at 17 Dunnell Rd, Greenfield, MA 01301 and is currently estimated at $375,548, approximately $234 per square foot. 17 Dunnell Rd is a home located in Franklin County with nearby schools including Cornerstone Christian School, Holy Trinity School, and Greenfield Center School.
Ownership History
Date
Name
Owned For
Owner Type
Purchase Details
Closed on
Jun 8, 2018
Sold by
Drew Douglas O and Mcgahan-Drew Julie
Bought by
Drew Ft
Current Estimated Value
Purchase Details
Closed on
Jun 15, 1989
Sold by
Evans Daniel P
Bought by
Drew Douglas O
Purchase Details
Closed on
Jul 31, 1987
Sold by
Echeverria Thomas S
Bought by
Evans Daniel P
Create a Home Valuation Report for This Property
The Home Valuation Report is an in-depth analysis detailing your home's value as well as a comparison with similar homes in the area
Home Values in the Area
Average Home Value in this Area
Purchase History
| Date | Buyer | Sale Price | Title Company |
|---|---|---|---|
| Drew Ft | -- | -- | |
| Drew Ft | -- | -- | |
| Drew Douglas O | $130,000 | -- | |
| Drew Douglas O | $130,000 | -- | |
| Evans Daniel P | $112,500 | -- |
Source: Public Records
Mortgage History
| Date | Status | Borrower | Loan Amount |
|---|---|---|---|
| Previous Owner | Evans Daniel P | $131,600 | |
| Previous Owner | Evans Daniel P | $33,000 | |
| Previous Owner | Evans Daniel P | $79,000 |
Source: Public Records
Tax History
| Year | Tax Paid | Tax Assessment Tax Assessment Total Assessment is a certain percentage of the fair market value that is determined by local assessors to be the total taxable value of land and additions on the property. | Land | Improvement |
|---|---|---|---|---|
| 2025 | $6,064 | $310,000 | $82,700 | $227,300 |
| 2024 | $6,086 | $298,500 | $75,200 | $223,300 |
| 2023 | $5,494 | $279,600 | $75,200 | $204,400 |
| 2022 | $5,381 | $241,100 | $71,600 | $169,500 |
| 2021 | $5,104 | $219,800 | $72,300 | $147,500 |
| 2020 | $4,774 | $208,200 | $65,900 | $142,300 |
| 2019 | $4,470 | $199,900 | $57,300 | $142,600 |
| 2018 | $4,416 | $196,900 | $56,600 | $140,300 |
| 2017 | $4,024 | $185,200 | $56,600 | $128,600 |
| 2016 | $3,987 | $182,800 | $55,500 | $127,300 |
| 2015 | $3,991 | $177,300 | $53,700 | $123,600 |
| 2014 | $3,640 | $177,300 | $53,700 | $123,600 |
Source: Public Records
Map
Nearby Homes
Your Personal Tour Guide
Ask me questions while you tour the home.