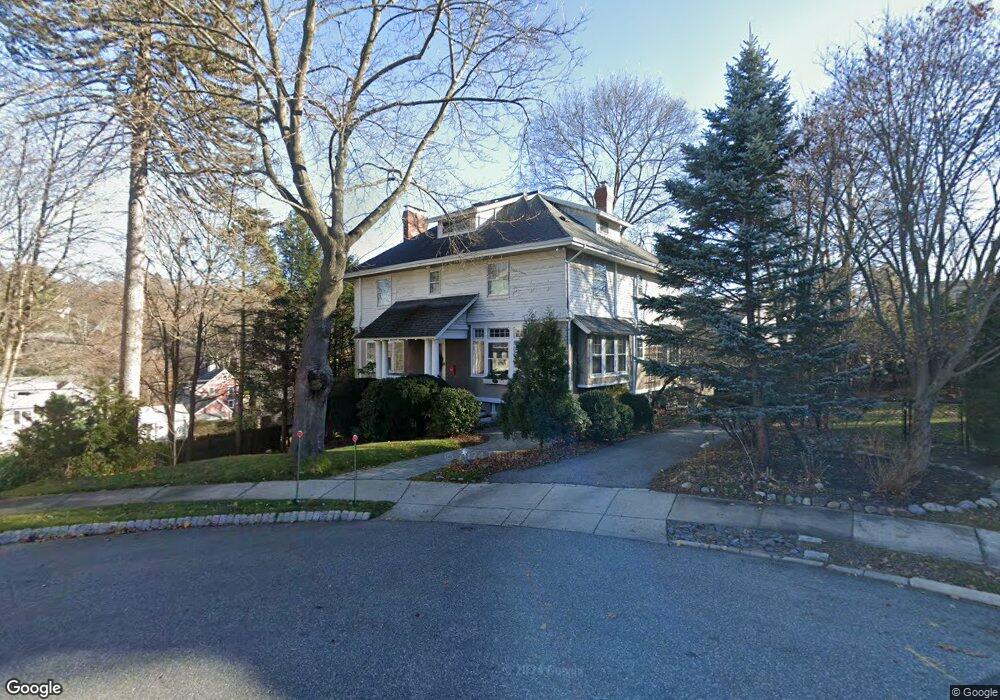
17 Edgehill Rd Winchester, MA 01890
Grove Street NeighborhoodEstimated Value: $1,855,000 - $2,161,000
6
Beds
3
Baths
3,308
Sq Ft
$614/Sq Ft
Est. Value
About This Home
This home is located at 17 Edgehill Rd, Winchester, MA 01890 and is currently estimated at $2,031,020, approximately $613 per square foot. 17 Edgehill Rd is a home located in Middlesex County with nearby schools including Ambrose Elementary School, McCall Middle School, and Winchester High School.
Ownership History
Date
Name
Owned For
Owner Type
Purchase Details
Closed on
Aug 17, 2018
Sold by
Cass Joy B
Bought by
Cass Ft
Current Estimated Value
Purchase Details
Closed on
Feb 11, 2009
Sold by
Cass Joy B and Cass Leo M
Bought by
Cass Joy B
Create a Home Valuation Report for This Property
The Home Valuation Report is an in-depth analysis detailing your home's value as well as a comparison with similar homes in the area
Home Values in the Area
Average Home Value in this Area
Purchase History
| Date | Buyer | Sale Price | Title Company |
|---|---|---|---|
| Cass Ft | -- | -- | |
| Cass Joy B | -- | -- |
Source: Public Records
Tax History Compared to Growth
Tax History
| Year | Tax Paid | Tax Assessment Tax Assessment Total Assessment is a certain percentage of the fair market value that is determined by local assessors to be the total taxable value of land and additions on the property. | Land | Improvement |
|---|---|---|---|---|
| 2025 | $206 | $1,855,800 | $1,019,800 | $836,000 |
| 2024 | $19,736 | $1,741,900 | $946,900 | $795,000 |
| 2023 | $18,297 | $1,550,600 | $874,100 | $676,500 |
| 2022 | $17,580 | $1,405,300 | $764,800 | $640,500 |
| 2021 | $17,213 | $1,341,600 | $701,100 | $640,500 |
| 2020 | $16,622 | $1,341,600 | $701,100 | $640,500 |
| 2019 | $15,144 | $1,250,500 | $610,000 | $640,500 |
| 2018 | $14,669 | $1,203,400 | $580,900 | $622,500 |
| 2017 | $14,468 | $1,178,200 | $580,900 | $597,300 |
| 2016 | $13,633 | $1,167,200 | $580,900 | $586,300 |
| 2015 | $13,354 | $1,100,000 | $528,100 | $571,900 |
| 2014 | $12,826 | $1,013,100 | $441,600 | $571,500 |
Source: Public Records
Map
Nearby Homes
- 446 Highland Ave
- 77A Brooks St
- 5 Bacon St
- 19 Town Way
- 26 North Gateway
- 39 Town Way
- 8 Felsdale Close
- 12 Canterbury Rd
- 20 Grove Place
- 9 Lakeview Terrace
- 30 Prospect St
- 53 Bacon St
- 5 Norwich Cir
- 2 Everett Ave
- 595 Winthrop St
- 10 Apache Trail
- 46 Church St
- 545 Winthrop St Unit Lot 9
- 545 Winthrop St Unit Lot 10
- 545 Winthrop St Unit Lot 5