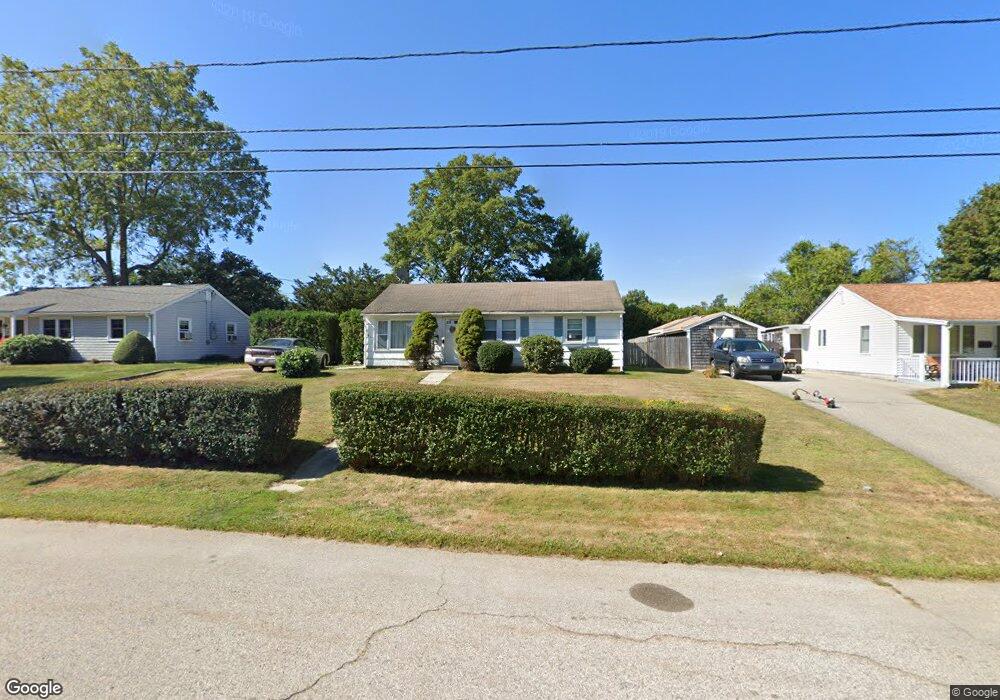
17 Greenway Dr Bristol, RI 02809
The Narrows NeighborhoodEstimated Value: $349,000 - $401,000
3
Beds
1
Bath
864
Sq Ft
$429/Sq Ft
Est. Value
About This Home
This home is located at 17 Greenway Dr, Bristol, RI 02809 and is currently estimated at $370,231, approximately $428 per square foot. 17 Greenway Dr is a home located in Bristol County with nearby schools including Mt. Hope High School, Highlander Charter Middle and High School, and Our Lady of Mt. Carmel School.
Ownership History
Date
Name
Owned For
Owner Type
Purchase Details
Closed on
Jul 19, 2022
Sold by
Mccann Steven P and Mccann Raymond E
Bought by
Mello Shannon M and Conto Jacob A
Current Estimated Value
Home Financials for this Owner
Home Financials are based on the most recent Mortgage that was taken out on this home.
Original Mortgage
$259,661
Outstanding Balance
$248,508
Interest Rate
5.81%
Mortgage Type
FHA
Estimated Equity
$121,723
Purchase Details
Closed on
May 27, 2021
Sold by
Mccann Henry P
Bought by
Mccann Steven P and Mccann Raymond E
Create a Home Valuation Report for This Property
The Home Valuation Report is an in-depth analysis detailing your home's value as well as a comparison with similar homes in the area
Home Values in the Area
Average Home Value in this Area
Purchase History
| Date | Buyer | Sale Price | Title Company |
|---|---|---|---|
| Mello Shannon M | $208,000 | None Available | |
| Mello Shannon M | $208,000 | None Available | |
| Mccann Steven P | -- | None Available | |
| Mccann Steven P | -- | None Available |
Source: Public Records
Mortgage History
| Date | Status | Borrower | Loan Amount |
|---|---|---|---|
| Open | Mello Shannon M | $259,661 | |
| Closed | Mello Shannon M | $259,661 |
Source: Public Records
Tax History Compared to Growth
Tax History
| Year | Tax Paid | Tax Assessment Tax Assessment Total Assessment is a certain percentage of the fair market value that is determined by local assessors to be the total taxable value of land and additions on the property. | Land | Improvement |
|---|---|---|---|---|
| 2025 | $3,264 | $236,200 | $137,800 | $98,400 |
| 2024 | $3,264 | $236,200 | $137,800 | $98,400 |
| 2023 | $3,156 | $236,200 | $137,800 | $98,400 |
| 2022 | $3,071 | $236,200 | $137,800 | $98,400 |
| 2021 | $2,921 | $203,100 | $126,800 | $76,300 |
| 2020 | $2,858 | $203,100 | $126,800 | $76,300 |
| 2019 | $2,787 | $203,100 | $126,800 | $76,300 |
| 2018 | $3,178 | $206,600 | $121,100 | $85,500 |
| 2017 | $2,620 | $175,600 | $104,900 | $70,700 |
| 2016 | $2,594 | $175,600 | $104,900 | $70,700 |
| 2015 | $2,464 | $175,600 | $104,900 | $70,700 |
| 2014 | $2,414 | $184,870 | $112,100 | $72,770 |
Source: Public Records
Map
Nearby Homes