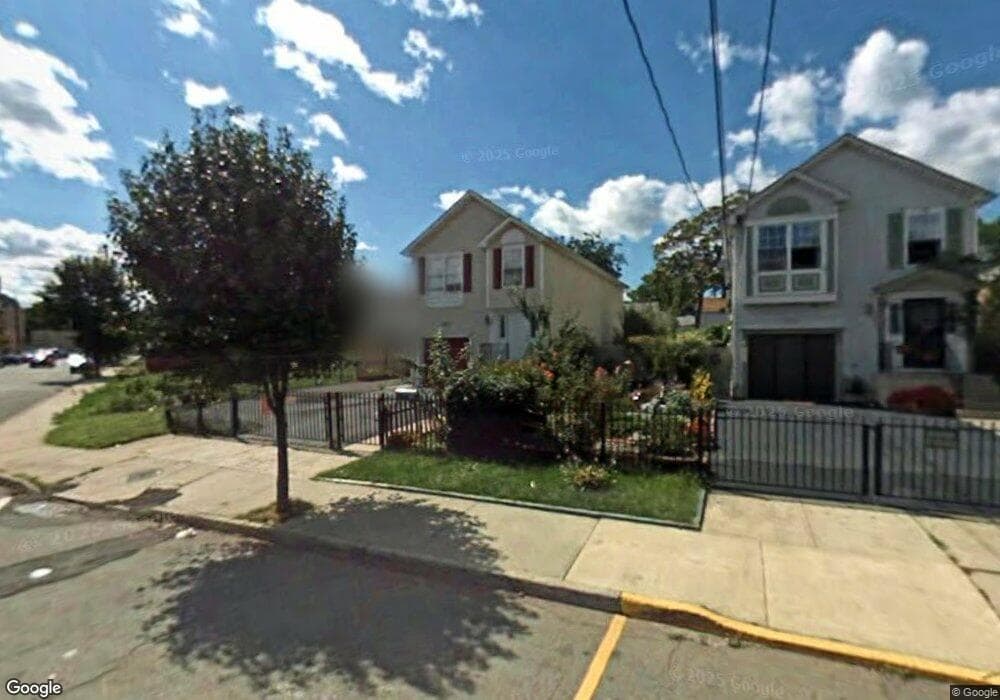
17 Jacob St Unit 19 Newark, NJ 07103
West Side NeighborhoodEstimated Value: $438,506 - $515,000
--
Bed
--
Bath
1,740
Sq Ft
$281/Sq Ft
Est. Value
About This Home
This home is located at 17 Jacob St Unit 19, Newark, NJ 07103 and is currently estimated at $488,627, approximately $280 per square foot. 17 Jacob St Unit 19 is a home located in Essex County with nearby schools including Harriet Tubman School, Camden Street Elementary School, and Cleveland Elementary School.
Ownership History
Date
Name
Owned For
Owner Type
Purchase Details
Closed on
May 17, 2021
Sold by
Pupo Sandra
Bought by
Ogundele Oluwagbemiga Joshua
Current Estimated Value
Home Financials for this Owner
Home Financials are based on the most recent Mortgage that was taken out on this home.
Original Mortgage
$328,652
Outstanding Balance
$296,905
Interest Rate
2.9%
Mortgage Type
FHA
Estimated Equity
$191,722
Purchase Details
Closed on
Oct 9, 2012
Sold by
Pupo Michael Y and Pupo Sandra
Bought by
Pupo Sandra and Galicia Sandra
Purchase Details
Closed on
Sep 20, 2005
Sold by
New Jersey Housing & Mtg Finan
Bought by
Pupo Yunior and Galicia Sandra
Home Financials for this Owner
Home Financials are based on the most recent Mortgage that was taken out on this home.
Original Mortgage
$208,472
Interest Rate
5.72%
Purchase Details
Closed on
Jan 6, 2000
Sold by
Macedonia Ministries
Bought by
Forman Charles
Create a Home Valuation Report for This Property
The Home Valuation Report is an in-depth analysis detailing your home's value as well as a comparison with similar homes in the area
Home Values in the Area
Average Home Value in this Area
Purchase History
| Date | Buyer | Sale Price | Title Company |
|---|---|---|---|
| Ogundele Oluwagbemiga Joshua | $340,000 | None Listed On Document | |
| Pupo Sandra | -- | None Available | |
| Pupo Yunior | $260,590 | -- | |
| Forman Charles | $143,000 | -- |
Source: Public Records
Mortgage History
| Date | Status | Borrower | Loan Amount |
|---|---|---|---|
| Open | Ogundele Oluwagbemiga Joshua | $328,652 | |
| Previous Owner | Pupo Yunior | $208,472 |
Source: Public Records
Tax History Compared to Growth
Tax History
| Year | Tax Paid | Tax Assessment Tax Assessment Total Assessment is a certain percentage of the fair market value that is determined by local assessors to be the total taxable value of land and additions on the property. | Land | Improvement |
|---|---|---|---|---|
| 2025 | $5,391 | $144,600 | $33,000 | $111,600 |
| 2024 | $5,391 | $144,600 | $33,000 | $111,600 |
| 2023 | $5,402 | $144,600 | $33,000 | $111,600 |
| 2022 | $5,402 | $144,600 | $33,000 | $111,600 |
| 2021 | $5,399 | $144,600 | $33,000 | $111,600 |
| 2020 | $5,495 | $144,600 | $33,000 | $111,600 |
| 2019 | $5,438 | $144,600 | $33,000 | $111,600 |
| 2018 | $5,340 | $144,600 | $33,000 | $111,600 |
| 2017 | $5,148 | $144,600 | $33,000 | $111,600 |
| 2016 | $4,974 | $144,600 | $33,000 | $111,600 |
| 2015 | $4,785 | $144,600 | $33,000 | $111,600 |
| 2014 | $4,484 | $144,600 | $33,000 | $111,600 |
Source: Public Records
Map
Nearby Homes
- 21 Jacob St
- 21 S Jacob St
- 23 Jacob St
- 28-30 Holland St
- 24 Holland St Unit 26
- 24-26 Holland St
- 22 Holland St
- 25 Jacob St
- 32 Holland St Unit 2
- 32 Holland St Unit 1
- 20 Holland St
- 27 Jacob St
- 16 Holland St Unit 18
- 444 S 7th St Unit 446
- 444 S 7th St Unit 1
- 444-446 S 7th St
- 442 S 7th St
- 29-31 S Jacob St
- 29 S Jacob St
- 29 Jacob St Unit 31