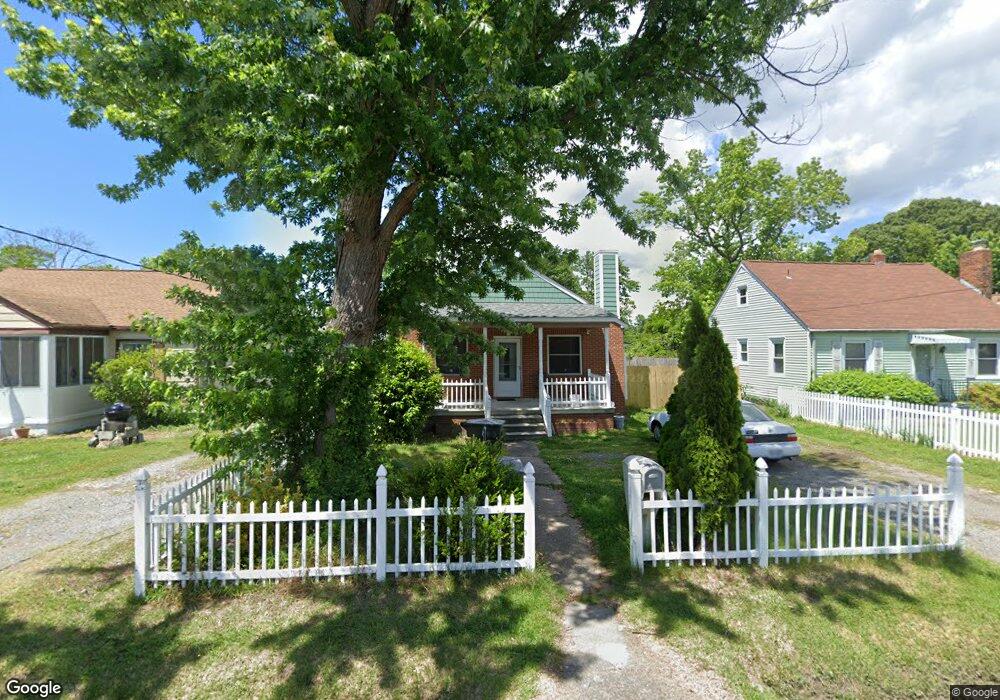
17 Kenneth St Hampton, VA 23669
Westhampton NeighborhoodEstimated Value: $167,940 - $219,000
2
Beds
1
Bath
1,017
Sq Ft
$188/Sq Ft
Est. Value
About This Home
This home is located at 17 Kenneth St, Hampton, VA 23669 and is currently estimated at $190,985, approximately $187 per square foot. 17 Kenneth St is a home located in Hampton City with nearby schools including Bassette Elementary School, C. Alton Lindsay Middle School, and Phoebus High School.
Ownership History
Date
Name
Owned For
Owner Type
Purchase Details
Closed on
Dec 10, 2004
Sold by
Clark David
Bought by
Moultrie Shanay
Current Estimated Value
Home Financials for this Owner
Home Financials are based on the most recent Mortgage that was taken out on this home.
Original Mortgage
$80,698
Outstanding Balance
$40,144
Interest Rate
5.63%
Mortgage Type
VA
Estimated Equity
$150,841
Purchase Details
Closed on
Nov 20, 1999
Sold by
Beaufait Joseph A
Bought by
Clark David A
Home Financials for this Owner
Home Financials are based on the most recent Mortgage that was taken out on this home.
Original Mortgage
$54,570
Interest Rate
7.77%
Create a Home Valuation Report for This Property
The Home Valuation Report is an in-depth analysis detailing your home's value as well as a comparison with similar homes in the area
Home Values in the Area
Average Home Value in this Area
Purchase History
| Date | Buyer | Sale Price | Title Company |
|---|---|---|---|
| Moultrie Shanay | $79,000 | -- | |
| Clark David A | $53,500 | -- |
Source: Public Records
Mortgage History
| Date | Status | Borrower | Loan Amount |
|---|---|---|---|
| Open | Moultrie Shanay | $80,698 | |
| Previous Owner | Clark David A | $54,570 |
Source: Public Records
Tax History
| Year | Tax Paid | Tax Assessment Tax Assessment Total Assessment is a certain percentage of the fair market value that is determined by local assessors to be the total taxable value of land and additions on the property. | Land | Improvement |
|---|---|---|---|---|
| 2025 | $1,500 | $128,600 | $40,000 | $88,600 |
| 2024 | $1,237 | $107,600 | $40,000 | $67,600 |
| 2023 | $1,197 | $103,200 | $40,000 | $63,200 |
| 2022 | $1,184 | $100,300 | $35,700 | $64,600 |
| 2021 | $1,248 | $90,200 | $30,700 | $59,500 |
| 2020 | $1,073 | $86,500 | $30,700 | $55,800 |
| 2019 | $1,003 | $80,900 | $30,700 | $50,200 |
| 2018 | $1,114 | $82,300 | $30,700 | $51,600 |
| 2017 | $1,114 | $0 | $0 | $0 |
| 2016 | $1,114 | $82,300 | $0 | $0 |
| 2015 | $1,114 | $0 | $0 | $0 |
| 2014 | $1,344 | $85,500 | $30,700 | $54,800 |
Source: Public Records
Map
Nearby Homes
- 416 Worster Ave
- 460 England Ave
- 3818 Shell Rd
- 410 Worster Ave
- 622 Chapel St
- 714 Milford Ave
- 430 Newport News Ave
- 39 W Sunset Rd
- 50 Settlers Landing Rd
- 635 Homestead Ave
- 415 Lee St
- 621 Fairland Ave
- 44 Henry St
- 438 Highland Ave
- 806 Fairland Ave
- 733 Fairland Ave
- 381 W Queen St
- 632 Westwood Ave
- 373 W Queen St
- 363 W Queen St
Your Personal Tour Guide
Ask me questions while you tour the home.