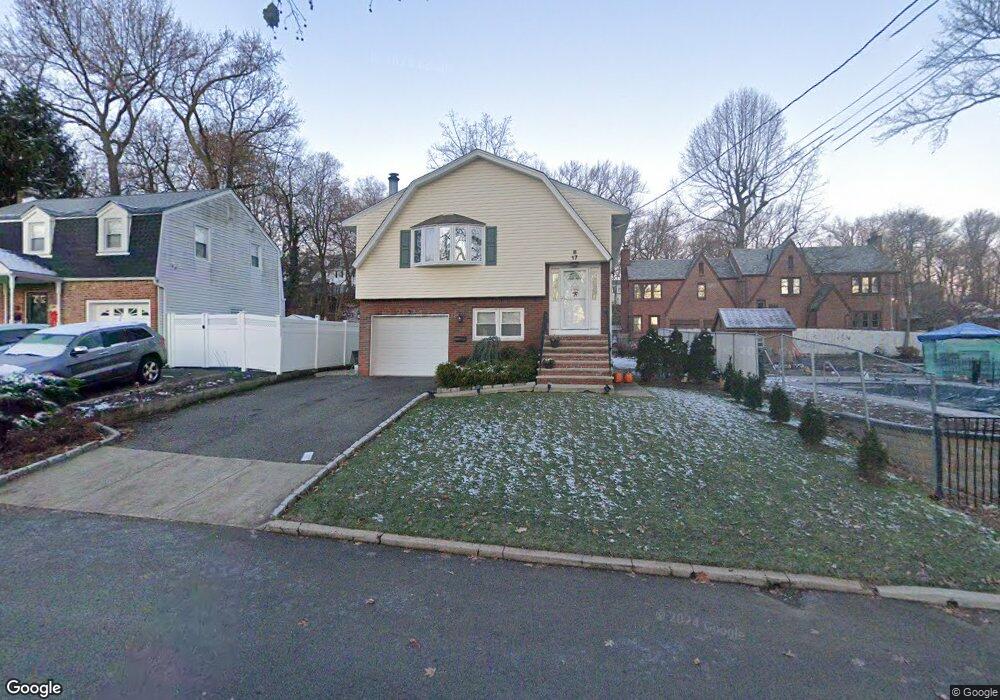
17 Louis St Hackensack, NJ 07601
Estimated Value: $733,000 - $893,000
5
Beds
2
Baths
2,309
Sq Ft
$350/Sq Ft
Est. Value
About This Home
This home is located at 17 Louis St, Hackensack, NJ 07601 and is currently estimated at $808,035, approximately $349 per square foot. 17 Louis St is a home located in Bergen County with nearby schools including Hackensack High School, Bergen County Christian Academy, and Ben Porat Yosef.
Ownership History
Date
Name
Owned For
Owner Type
Purchase Details
Closed on
Oct 29, 2018
Sold by
Campos Jose
Bought by
Campos Jose and Cohen Lourdes M
Current Estimated Value
Purchase Details
Closed on
Feb 9, 2018
Sold by
Deismone Domenick and Rammunni Filomena
Bought by
Campos Jose W
Home Financials for this Owner
Home Financials are based on the most recent Mortgage that was taken out on this home.
Original Mortgage
$432,250
Interest Rate
3.99%
Mortgage Type
Purchase Money Mortgage
Purchase Details
Closed on
Aug 21, 2017
Sold by
Varzegar Minoo and Bahmani Shiva
Bought by
Desimone Domenick and Ramunni Filomena
Purchase Details
Closed on
Nov 16, 2001
Sold by
Sam Edwin
Bought by
Varzegar Minoo
Home Financials for this Owner
Home Financials are based on the most recent Mortgage that was taken out on this home.
Original Mortgage
$256,000
Interest Rate
6.67%
Create a Home Valuation Report for This Property
The Home Valuation Report is an in-depth analysis detailing your home's value as well as a comparison with similar homes in the area
Home Values in the Area
Average Home Value in this Area
Purchase History
| Date | Buyer | Sale Price | Title Company |
|---|---|---|---|
| Campos Jose | $213,000 | -- | |
| Campos Jose W | $455,000 | -- | |
| Desimone Domenick | $208,000 | -- | |
| Varzegar Minoo | $320,000 | -- |
Source: Public Records
Mortgage History
| Date | Status | Borrower | Loan Amount |
|---|---|---|---|
| Previous Owner | Campos Jose W | $432,250 | |
| Previous Owner | Varzegar Minoo | $256,000 |
Source: Public Records
Tax History
| Year | Tax Paid | Tax Assessment Tax Assessment Total Assessment is a certain percentage of the fair market value that is determined by local assessors to be the total taxable value of land and additions on the property. | Land | Improvement |
|---|---|---|---|---|
| 2025 | $14,800 | $484,300 | $191,400 | $292,900 |
| 2024 | $13,943 | $484,300 | $191,400 | $292,900 |
| 2023 | $13,511 | $484,300 | $191,400 | $292,900 |
| 2022 | $13,511 | $482,200 | $187,600 | $294,600 |
| 2021 | $13,556 | $403,700 | $169,600 | $234,100 |
| 2020 | $13,358 | $403,700 | $169,600 | $234,100 |
| 2019 | $13,331 | $397,100 | $166,600 | $230,500 |
| 2018 | $12,679 | $371,500 | $162,600 | $208,900 |
| 2017 | $11,314 | $331,300 | $160,100 | $171,200 |
| 2016 | $10,624 | $314,500 | $145,100 | $169,400 |
| 2015 | $11,974 | $342,100 | $150,000 | $192,100 |
| 2014 | $11,365 | $342,100 | $150,000 | $192,100 |
Source: Public Records
Map
Nearby Homes
- 258 Ross Ave
- 207 Elm Ave
- 290 Clinton Place
- 120 Louis St
- 67 Spring Valley Ave
- 137 Byrne St
- 258 Clinton Place
- 95 Cedar Ave
- 75 Pine St
- 467 Summit Ave
- 162 E Fairmount Ave
- 81 Fairmount Ave
- 29 Martin Terrace
- 32 Martin Terrace
- 300 Lookout Ave Unit C4
- 262 Spring Valley Ave
- 149 Allen St
- 150 Grand Ave Unit 1A
- 446 Passaic St Unit 2A
- 290 Anderson St Unit 5D
Your Personal Tour Guide
Ask me questions while you tour the home.