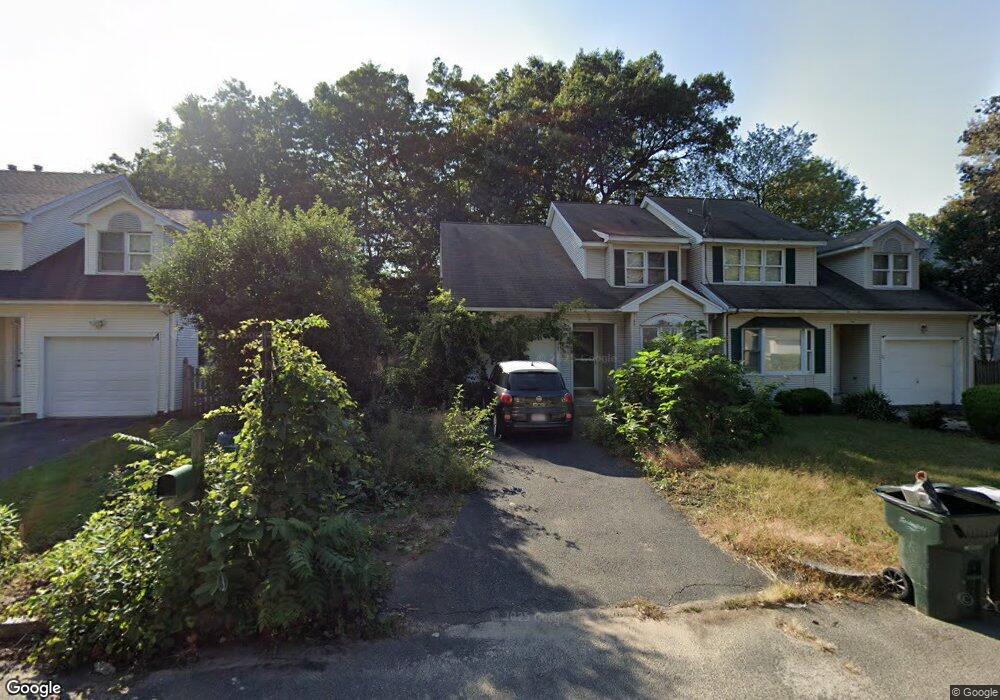
17 Luden St Springfield, MA 01118
East Forest Park NeighborhoodEstimated Value: $283,000 - $303,000
3
Beds
2
Baths
1,272
Sq Ft
$231/Sq Ft
Est. Value
About This Home
This home is located at 17 Luden St, Springfield, MA 01118 and is currently estimated at $293,514, approximately $230 per square foot. 17 Luden St is a home located in Hampden County with nearby schools including Frederick Harris Elementary School, M Marcus Kiley Middle, and Springfield High School of Science and Technology.
Ownership History
Date
Name
Owned For
Owner Type
Purchase Details
Closed on
Dec 2, 1992
Sold by
Luden Rlty Grp Inc
Bought by
Alberto Eduardo A and Alberto Jennifer S
Current Estimated Value
Home Financials for this Owner
Home Financials are based on the most recent Mortgage that was taken out on this home.
Original Mortgage
$113,969
Interest Rate
8.22%
Mortgage Type
Purchase Money Mortgage
Create a Home Valuation Report for This Property
The Home Valuation Report is an in-depth analysis detailing your home's value as well as a comparison with similar homes in the area
Home Values in the Area
Average Home Value in this Area
Purchase History
| Date | Buyer | Sale Price | Title Company |
|---|---|---|---|
| Alberto Eduardo A | $113,500 | -- |
Source: Public Records
Mortgage History
| Date | Status | Borrower | Loan Amount |
|---|---|---|---|
| Closed | Alberto Eduardo A | $113,969 |
Source: Public Records
Tax History Compared to Growth
Tax History
| Year | Tax Paid | Tax Assessment Tax Assessment Total Assessment is a certain percentage of the fair market value that is determined by local assessors to be the total taxable value of land and additions on the property. | Land | Improvement |
|---|---|---|---|---|
| 2025 | $3,388 | $216,100 | $43,700 | $172,400 |
| 2024 | $3,185 | $198,300 | $43,700 | $154,600 |
| 2023 | $3,076 | $179,200 | $41,600 | $137,600 |
| 2022 | $3,246 | $172,500 | $41,600 | $130,900 |
| 2021 | $2,807 | $148,500 | $37,800 | $110,700 |
| 2020 | $2,707 | $138,600 | $37,800 | $100,800 |
| 2019 | $2,488 | $126,400 | $37,800 | $88,600 |
| 2018 | $2,560 | $130,100 | $37,800 | $92,300 |
| 2017 | $3,077 | $156,500 | $37,800 | $118,700 |
| 2016 | $2,855 | $145,200 | $37,800 | $107,400 |
| 2015 | $2,840 | $144,400 | $37,800 | $106,600 |
Source: Public Records
Map
Nearby Homes
- 80 Tulsa St
- 155 Powell Ave
- 36 Sunapee St
- 26 Dwight Rd
- 261 W Allen Ridge Rd
- 78 Blaine St
- 63 Webber St
- 56 Hadley St
- 36 Garland St
- 108 Brunswick St
- 13 Bither St
- 43 Thorndyke St
- 88 Brunswick St
- 34 Castle St
- 10 Kelsey St
- 77 W Allen Ridge Rd
- 157 Canterbury Rd
- 914-916 Belmont Ave
- 26 Harkness Ave
- 910-912 Belmont Ave