
Seller's Agent in 2022
Jessica Marshall
EXP Realty
(603) 465-1114
14 in this area
198 Total Sales
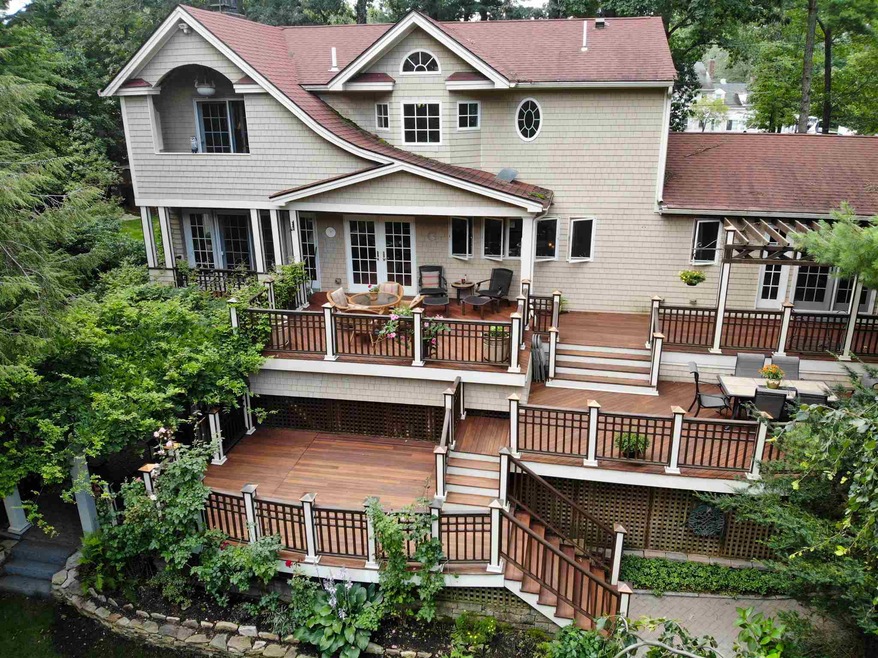
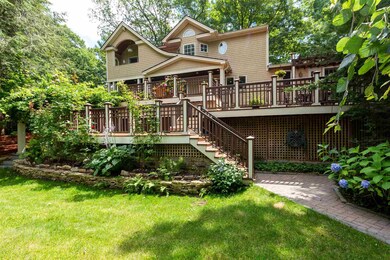
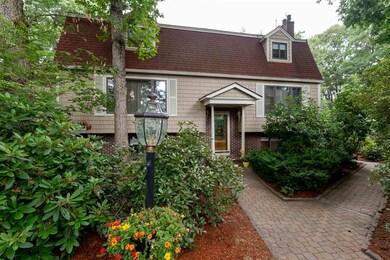
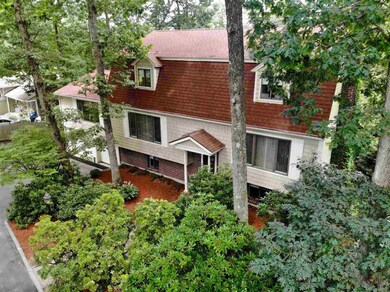
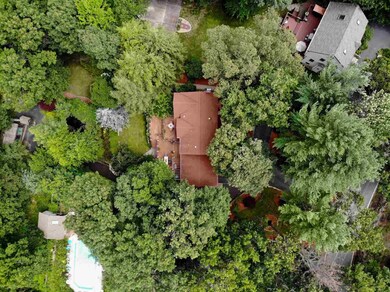
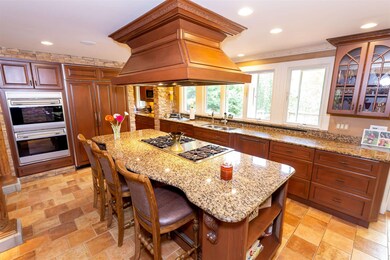
This home is located at 17 Middle Dunstable Rd, Nashua, NH 03062 and is currently priced at $730,000, approximately $283 per square foot. This property was built in 1975. 17 Middle Dunstable Rd is a home located in Hillsborough County with nearby schools including Bicentennial Elementary School, Fairgrounds Middle School, and Nashua High School South.
| Date | Type | Sale Price | Title Company |
|---|---|---|---|
| Warranty Deed | $799,000 | None Available | |
| Warranty Deed | $799,000 | None Available | |
| Quit Claim Deed | -- | None Available | |
| Quit Claim Deed | -- | None Available | |
| Warranty Deed | $730,000 | None Available | |
| Deed | $540,000 | -- | |
| Deed | $540,000 | -- | |
| Quit Claim Deed | -- | -- | |
| Quit Claim Deed | -- | -- | |
| Deed | -- | -- |
| Date | Status | Loan Amount | Loan Type |
|---|---|---|---|
| Previous Owner | $511,000 | Purchase Money Mortgage | |
| Previous Owner | $446,448 | VA | |
| Previous Owner | $479,184 | No Value Available | |
| Previous Owner | $350,000 | Unknown | |
| Closed | $0 | No Value Available |
| Date | Event | Price | Change | Sq Ft Price |
|---|---|---|---|---|
| 12/16/2022 12/16/22 | Sold | $799,000 | 0.0% | $241 / Sq Ft |
| 11/11/2022 11/11/22 | Pending | -- | -- | -- |
| 11/02/2022 11/02/22 | For Sale | $799,000 | +9.5% | $241 / Sq Ft |
| 12/08/2021 12/08/21 | Sold | $730,000 | 0.0% | $220 / Sq Ft |
| 11/01/2021 11/01/21 | Pending | -- | -- | -- |
| 11/01/2021 11/01/21 | Off Market | $730,000 | -- | -- |
| 10/12/2021 10/12/21 | Pending | -- | -- | -- |
| 09/28/2021 09/28/21 | Price Changed | $749,900 | -6.3% | $226 / Sq Ft |
| 09/20/2021 09/20/21 | Price Changed | $800,000 | -4.8% | $241 / Sq Ft |
| 09/01/2021 09/01/21 | Price Changed | $840,000 | -4.0% | $253 / Sq Ft |
| 08/06/2021 08/06/21 | For Sale | $875,000 | +62.0% | $264 / Sq Ft |
| 05/23/2014 05/23/14 | Sold | $540,000 | -16.9% | $210 / Sq Ft |
| 03/04/2014 03/04/14 | Pending | -- | -- | -- |
| 01/18/2014 01/18/14 | For Sale | $649,999 | -- | $252 / Sq Ft |
| Year | Tax Paid | Tax Assessment Tax Assessment Total Assessment is a certain percentage of the fair market value that is determined by local assessors to be the total taxable value of land and additions on the property. | Land | Improvement |
|---|---|---|---|---|
| 2023 | $12,732 | $698,400 | $157,900 | $540,500 |
| 2022 | $12,620 | $698,400 | $157,900 | $540,500 |
| 2021 | $11,738 | $505,500 | $117,200 | $388,300 |
| 2020 | $11,508 | $509,000 | $117,200 | $391,800 |
| 2019 | $11,076 | $509,000 | $117,200 | $391,800 |
| 2018 | $10,796 | $509,000 | $117,200 | $391,800 |
| 2017 | $12,972 | $503,000 | $100,600 | $402,400 |
| 2016 | $12,610 | $503,000 | $100,600 | $402,400 |
| 2015 | $12,339 | $503,000 | $100,600 | $402,400 |
Seller's Agent in 2022
Jessica Marshall
EXP Realty
(603) 465-1114
14 in this area
198 Total Sales
M
Buyer's Agent in 2022
Matthew Flathers
EXP Realty
(603) 781-7284
1 in this area
55 Total Sales
Buyer's Agent in 2021
Blake Boyland
Laer Realty Partners Janet Cramb and Company
(978) 660-0097
1 in this area
9 Total Sales
Seller's Agent in 2014
Kathy Snyder
Monument Realty
(603) 557-8599
24 in this area
219 Total Sales
G
Buyer's Agent in 2014
Geri Palmer
BHHS Verani Windham
Source: PrimeMLS
MLS Number: 4876409
APN: NASH-000000-000000-002025B
Disclaimer: Certain information contained herein is derived from information provided by parties other than Homes.com. All information provided is deemed reliable, but is not guaranteed to be accurate and should be independently verified.
![]() Copyright 2025 PrimeMLS, Inc. All rights reserved. This information is deemed reliable, but not guaranteed. The data relating to real estate displayed on this display comes in part from the IDX Program of PrimeMLS. The information being provided is for consumers’ personal, non-commercial use and may not be used for any purpose other than to identify prospective properties consumers may be interested in purchasing.
Copyright 2025 PrimeMLS, Inc. All rights reserved. This information is deemed reliable, but not guaranteed. The data relating to real estate displayed on this display comes in part from the IDX Program of PrimeMLS. The information being provided is for consumers’ personal, non-commercial use and may not be used for any purpose other than to identify prospective properties consumers may be interested in purchasing.