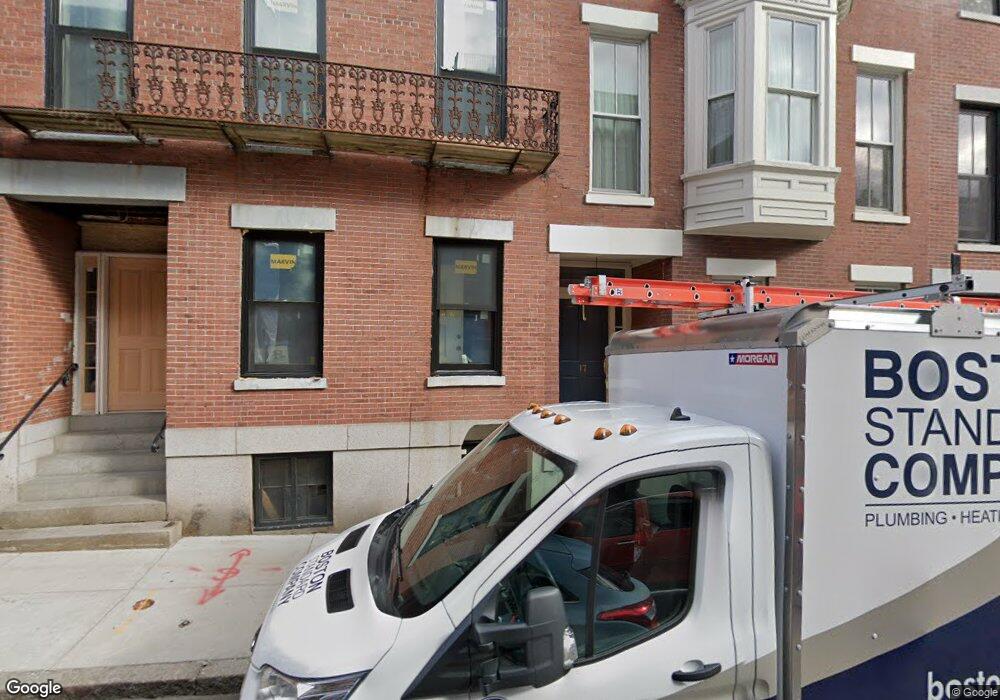
17 Monument Ave Charlestown, MA 02129
Thompson Square-Bunker Hill NeighborhoodEstimated Value: $2,667,000 - $2,833,433
3
Beds
3
Baths
2,800
Sq Ft
$986/Sq Ft
Est. Value
About This Home
This home is located at 17 Monument Ave, Charlestown, MA 02129 and is currently estimated at $2,761,108, approximately $986 per square foot. 17 Monument Ave is a home located in Suffolk County with nearby schools including Boston Children's School and St John School.
Ownership History
Date
Name
Owned For
Owner Type
Purchase Details
Closed on
May 24, 2022
Sold by
Stangle Derek W and Stangle Kathryn K
Bought by
Lamson Robert and Lamson Dacia
Current Estimated Value
Home Financials for this Owner
Home Financials are based on the most recent Mortgage that was taken out on this home.
Original Mortgage
$1,968,750
Outstanding Balance
$1,858,175
Interest Rate
4.72%
Mortgage Type
Purchase Money Mortgage
Estimated Equity
$902,933
Purchase Details
Closed on
Aug 12, 2016
Sold by
Oconnell Sean P and Oconnell Jilliam F
Bought by
Stangle Derek W and Stangle Kathryn K
Home Financials for this Owner
Home Financials are based on the most recent Mortgage that was taken out on this home.
Original Mortgage
$1,120,000
Interest Rate
3%
Mortgage Type
Adjustable Rate Mortgage/ARM
Purchase Details
Closed on
Jun 15, 2012
Sold by
Wonnacott David M and Wonnacott Deborah P
Bought by
Oconnell Sean P and Oconnell Jillian F
Purchase Details
Closed on
Mar 14, 2008
Sold by
Sykes Karen S and Sykes Ted
Bought by
Wonnacott David M and Wonnacott Deborah P
Purchase Details
Closed on
Sep 10, 2003
Sold by
Browne Mark S
Bought by
Sykes Karen S and Sykes Salvesen
Purchase Details
Closed on
Mar 31, 1993
Sold by
Leavitt Robt F and Leavitt Paige D
Bought by
Browne Mark S and Coyle John V
Create a Home Valuation Report for This Property
The Home Valuation Report is an in-depth analysis detailing your home's value as well as a comparison with similar homes in the area
Home Values in the Area
Average Home Value in this Area
Purchase History
| Date | Buyer | Sale Price | Title Company |
|---|---|---|---|
| Lamson Robert | $2,625,000 | None Available | |
| Stangle Derek W | $1,670,000 | -- | |
| Oconnell Sean P | $1,243,000 | -- | |
| Oconnell Sean P | $1,243,000 | -- | |
| Wonnacott David M | $1,385,000 | -- | |
| Wonnacott David M | $1,385,000 | -- | |
| Sykes Karen S | $1,050,000 | -- | |
| Browne Mark S | $225,000 | -- |
Source: Public Records
Mortgage History
| Date | Status | Borrower | Loan Amount |
|---|---|---|---|
| Open | Lamson Robert | $1,968,750 | |
| Previous Owner | Stangle Derek W | $1,120,000 | |
| Previous Owner | Browne Mark S | $461,600 | |
| Previous Owner | Browne Mark S | $28,850 |
Source: Public Records
Tax History Compared to Growth
Tax History
| Year | Tax Paid | Tax Assessment Tax Assessment Total Assessment is a certain percentage of the fair market value that is determined by local assessors to be the total taxable value of land and additions on the property. | Land | Improvement |
|---|---|---|---|---|
| 2025 | $28,010 | $2,418,800 | $589,200 | $1,829,600 |
| 2024 | $23,575 | $2,162,800 | $534,000 | $1,628,800 |
| 2023 | $21,503 | $2,002,100 | $494,500 | $1,507,600 |
| 2022 | $19,802 | $1,820,000 | $449,500 | $1,370,500 |
| 2021 | $19,419 | $1,820,000 | $449,500 | $1,370,500 |
| 2020 | $18,050 | $1,709,300 | $408,100 | $1,301,200 |
| 2019 | $17,669 | $1,676,400 | $327,300 | $1,349,100 |
| 2018 | $16,420 | $1,566,800 | $327,300 | $1,239,500 |
| 2017 | $15,702 | $1,482,700 | $327,300 | $1,155,400 |
| 2016 | $14,694 | $1,335,800 | $327,300 | $1,008,500 |
| 2015 | $12,697 | $1,048,500 | $288,200 | $760,300 |
| 2014 | $11,757 | $934,600 | $288,200 | $646,400 |
Source: Public Records
Map
Nearby Homes
- 17 Henley St Unit F
- 17 Henley St Unit B
- 46 High St
- 5 Wallace Ct
- 22 Harvard St
- 56 High St Unit 3
- 1 Washington Place
- 73 Chelsea St Unit 401
- 12 Prospect St Unit 2
- 12 Prospect St Unit 1
- 106 Bunker Hill St Unit 2
- 106 Bunker Hill St Unit 6
- 106 Bunker Hill St Unit 1
- 106 Bunker Hill St Unit 4P
- 106 Bunker Hill St Unit 3
- 172 Bunker Hill St Unit 1
- 207 Bunker Hill St Unit 2
- 9 Russell St Unit 2
- 9 Russell St Unit 1
- 15 Russell St
- 17 Monument Ave
- 19 Monument Ave
- 15 Monument Ave
- 15 Monument Ave Unit 1
- 21 Monument Ave
- 21 Monument Ave Unit 1
- 6 Soley St
- 8 Soley St
- 23 Monument Ave Unit A
- 23 Monument Ave
- 23 Monument Ave Unit 1
- 23 Monument Ave
- 23 Monument Ave Unit 23
- 4 Soley St
- 59 Warren St Unit 5
- 59 Warren St Unit 4
- 59 Warren St Unit 3
- 59 Warren St Unit 2
- 59 Warren St Unit 1
- 10 Soley St