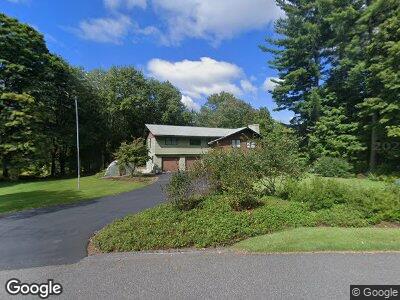
17 N Sycamore Knolls South Hadley, MA 01075
Estimated Value: $514,717 - $649,000
4
Beds
5
Baths
1,452
Sq Ft
$387/Sq Ft
Est. Value
About This Home
This home is located at 17 N Sycamore Knolls, South Hadley, MA 01075 and is currently estimated at $561,572, approximately $386 per square foot. 17 N Sycamore Knolls is a home located in Hampshire County with nearby schools including Plains Elementary School, Mosier Elementary School, and Michael E. Smith Middle School.
Ownership History
Date
Name
Owned For
Owner Type
Purchase Details
Closed on
Apr 6, 2004
Sold by
Frederick O Trump Irt and Trump Inge
Bought by
Weber Selene G and Weber Carl H
Current Estimated Value
Home Financials for this Owner
Home Financials are based on the most recent Mortgage that was taken out on this home.
Original Mortgage
$188,000
Interest Rate
5.56%
Mortgage Type
Purchase Money Mortgage
Purchase Details
Closed on
Feb 19, 2004
Sold by
Trump Frederick O
Bought by
Trump Norman F and Trump Christopher G
Home Financials for this Owner
Home Financials are based on the most recent Mortgage that was taken out on this home.
Original Mortgage
$188,000
Interest Rate
5.56%
Mortgage Type
Purchase Money Mortgage
Create a Home Valuation Report for This Property
The Home Valuation Report is an in-depth analysis detailing your home's value as well as a comparison with similar homes in the area
Home Values in the Area
Average Home Value in this Area
Purchase History
| Date | Buyer | Sale Price | Title Company |
|---|---|---|---|
| Weber Selene G | -- | -- | |
| Weber Selene G | $235,000 | -- | |
| Trump Norman F | -- | -- |
Source: Public Records
Mortgage History
| Date | Status | Borrower | Loan Amount |
|---|---|---|---|
| Open | Weber Selene G | $220,000 | |
| Closed | Weber Carl H | $50,000 | |
| Closed | Weber 3Rd Carl H | $259,200 | |
| Closed | Trump Norman F | $242,400 | |
| Closed | Weber Carl H | $255,000 | |
| Closed | Trump Norman F | $48,500 | |
| Closed | Trump Norman F | $188,000 |
Source: Public Records
Tax History Compared to Growth
Tax History
| Year | Tax Paid | Tax Assessment Tax Assessment Total Assessment is a certain percentage of the fair market value that is determined by local assessors to be the total taxable value of land and additions on the property. | Land | Improvement |
|---|---|---|---|---|
| 2025 | $8,374 | $516,600 | $168,200 | $348,400 |
| 2024 | $8,088 | $487,500 | $156,400 | $331,100 |
| 2023 | $7,319 | $411,900 | $142,500 | $269,400 |
| 2022 | $7,110 | $374,600 | $142,500 | $232,100 |
| 2021 | $0 | $350,000 | $133,300 | $216,700 |
| 2020 | $6,806 | $334,600 | $133,300 | $201,300 |
| 2019 | $6,950 | $338,200 | $145,100 | $193,100 |
| 2018 | $0 | $329,200 | $140,700 | $188,500 |
| 2017 | $6,533 | $316,200 | $140,700 | $175,500 |
| 2016 | $6,692 | $326,600 | $141,600 | $185,000 |
| 2015 | $6,826 | $336,900 | $137,700 | $199,200 |
Source: Public Records
Map
Nearby Homes
- 19 Hadley St Unit E14
- 78 Hadley St
- 32 Woodbridge St
- 25 Woodbridge St
- 2 Silverwood Terrace
- 21 Silver St
- 14 Silverwood Terrace
- 27 Ashfield Ln
- 8 Birch Hill Rd
- 18 Leahey Ave
- 226 Mosier St
- 31 College View Heights
- 124 College St Unit 20
- 4 Alvord St
- 19 Alvord Place
- 310 Alvord Place
- 120 Mosier St
- 2 Saybrook Cir
- Lot 6 Cold Hill
- Lot 7 Cold Hill
- 17 N Sycamore Knolls
- 21 N Sycamore Knolls
- 16 N Sycamore Knolls
- Lot B2 Stonegate Dr
- 20 N Sycamore Knolls
- 25 N Sycamore Knolls
- 7 Sycamore Park
- 13 Sycamore Park
- 9 Sycamore Park
- 17 Sycamore Knolls
- 11 Sycamore Park
- 6 Sycamore Park
- 22 S Sycamore Knolls
- 4 Sycamore Knolls
- 10 N Sycamore Knolls
- 10 Sycamore Park
- 12 Sycamore Park
- 9 N Sycamore Knolls
- 18 Sycamore Knolls
- 14 Sycamore Park