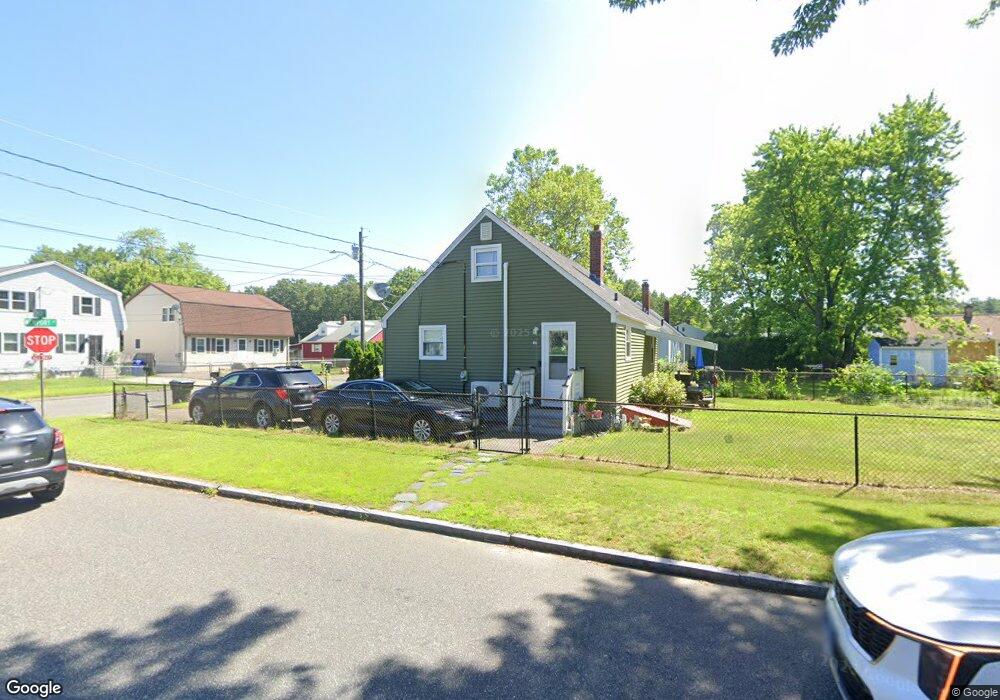
17 Newport St Springfield, MA 01119
Boston Road NeighborhoodEstimated Value: $251,000 - $275,000
4
Beds
1
Bath
1,075
Sq Ft
$246/Sq Ft
Est. Value
About This Home
This home is located at 17 Newport St, Springfield, MA 01119 and is currently estimated at $264,715, approximately $246 per square foot. 17 Newport St is a home located in Hampden County with nearby schools including Frank H. Freedman School, John F. Kennedy Academy, and Springfield Central High School.
Ownership History
Date
Name
Owned For
Owner Type
Purchase Details
Closed on
Sep 10, 2001
Sold by
Wimberly Willie P
Bought by
Osborne Wallace E
Current Estimated Value
Home Financials for this Owner
Home Financials are based on the most recent Mortgage that was taken out on this home.
Original Mortgage
$79,373
Outstanding Balance
$31,086
Interest Rate
7.05%
Mortgage Type
Purchase Money Mortgage
Estimated Equity
$233,629
Create a Home Valuation Report for This Property
The Home Valuation Report is an in-depth analysis detailing your home's value as well as a comparison with similar homes in the area
Home Values in the Area
Average Home Value in this Area
Purchase History
| Date | Buyer | Sale Price | Title Company |
|---|---|---|---|
| Osborne Wallace E | $80,000 | -- |
Source: Public Records
Mortgage History
| Date | Status | Borrower | Loan Amount |
|---|---|---|---|
| Open | Osborne Wallace E | $79,373 |
Source: Public Records
Tax History Compared to Growth
Tax History
| Year | Tax Paid | Tax Assessment Tax Assessment Total Assessment is a certain percentage of the fair market value that is determined by local assessors to be the total taxable value of land and additions on the property. | Land | Improvement |
|---|---|---|---|---|
| 2025 | $3,155 | $201,200 | $43,000 | $158,200 |
| 2024 | $2,770 | $172,500 | $40,200 | $132,300 |
| 2023 | $3,135 | $183,900 | $38,300 | $145,600 |
| 2022 | $2,823 | $150,000 | $38,300 | $111,700 |
| 2021 | $2,565 | $135,700 | $34,800 | $100,900 |
| 2020 | $2,449 | $125,400 | $34,800 | $90,600 |
| 2019 | $2,415 | $122,700 | $34,800 | $87,900 |
| 2018 | $2,401 | $122,000 | $34,800 | $87,200 |
| 2017 | $2,414 | $122,800 | $34,800 | $88,000 |
| 2016 | $2,385 | $121,300 | $34,800 | $86,500 |
| 2015 | $2,191 | $111,400 | $34,800 | $76,600 |
Source: Public Records
Map
Nearby Homes
- 34 Wallace St
- 108 Barre St
- 53 Holden St
- 100 Champlain St
- 110 Homestead Ave
- 70 Shumway St Unit 29
- 70 Shumway St Unit A1
- 110 Lamplighter Ln Unit C
- 42 Geneva St
- 37 Champlain Ave
- 55 Woodrow St
- 89 Pine Grove St
- 97-99 Pine Grove St
- 34 Temby St
- 56 Contessa Ln
- 195 Almira Rd
- 32 Better Way
- 543 Boston Rd
- 140 Cardinal St
- 25 Pioneer Way
- 11 Newport St
- 59 Elmore Ave
- 27 Newport St
- 7 Newport St
- 55 Elmore Ave
- 60 Elmore Ave
- 60 Brandon Ave
- 33 Newport St
- 3 Newport St
- 18 Newport St Unit 20
- 18-20 Newport St
- 12 Newport St Unit 14
- 12-14 Newport St
- 54 Brandon Ave
- 49 Elmore Ave
- 28 Newport St
- 6 Newport St
- 50 Elmore Ave
- 37-39 Newport St
- 37 Newport St Unit 39