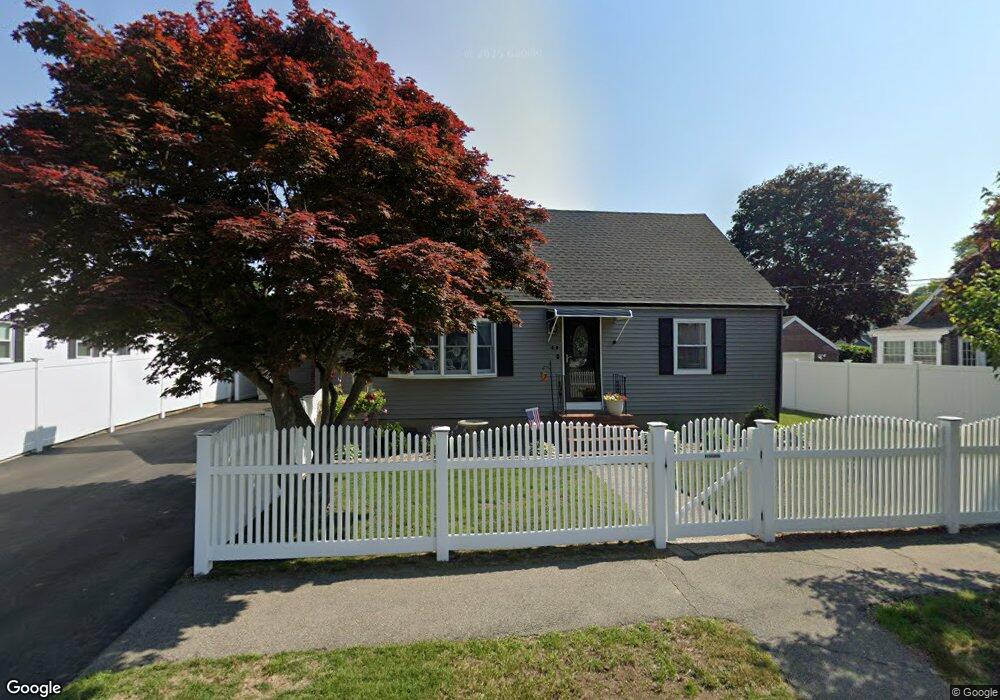
17 Rainbow Cir Peabody, MA 01960
South Peabody NeighborhoodEstimated Value: $486,783 - $597,000
2
Beds
1
Bath
864
Sq Ft
$638/Sq Ft
Est. Value
About This Home
This home is located at 17 Rainbow Cir, Peabody, MA 01960 and is currently estimated at $551,196, approximately $637 per square foot. 17 Rainbow Cir is a home located in Essex County with nearby schools including Peabody Veterans Memorial High School and St John The Baptist School.
Ownership History
Date
Name
Owned For
Owner Type
Purchase Details
Closed on
Jun 3, 2024
Sold by
Brown Sandra J and Brown Sandra J
Bought by
Brown Michael A and Brown Sandra J
Current Estimated Value
Home Financials for this Owner
Home Financials are based on the most recent Mortgage that was taken out on this home.
Original Mortgage
$100,000
Outstanding Balance
$97,034
Interest Rate
7.1%
Mortgage Type
Stand Alone Refi Refinance Of Original Loan
Estimated Equity
$454,162
Purchase Details
Closed on
Apr 10, 2024
Sold by
13 Granite Road Rt and Delp
Bought by
Brown Sandra J
Home Financials for this Owner
Home Financials are based on the most recent Mortgage that was taken out on this home.
Original Mortgage
$100,000
Outstanding Balance
$97,034
Interest Rate
7.1%
Mortgage Type
Stand Alone Refi Refinance Of Original Loan
Estimated Equity
$454,162
Create a Home Valuation Report for This Property
The Home Valuation Report is an in-depth analysis detailing your home's value as well as a comparison with similar homes in the area
Home Values in the Area
Average Home Value in this Area
Purchase History
| Date | Buyer | Sale Price | Title Company |
|---|---|---|---|
| Brown Michael A | -- | None Available | |
| 17 Rainbow Circle Rt | -- | None Available | |
| Brown Michael A | -- | None Available | |
| Brown Sandra J | -- | None Available | |
| Brown Sandra J | -- | None Available |
Source: Public Records
Mortgage History
| Date | Status | Borrower | Loan Amount |
|---|---|---|---|
| Open | 17 Rainbow Circle Rt | $100,000 | |
| Closed | Brown Michael A | $100,000 |
Source: Public Records
Tax History
| Year | Tax Paid | Tax Assessment Tax Assessment Total Assessment is a certain percentage of the fair market value that is determined by local assessors to be the total taxable value of land and additions on the property. | Land | Improvement |
|---|---|---|---|---|
| 2025 | $4,289 | $463,200 | $228,500 | $234,700 |
| 2024 | $4,076 | $446,900 | $228,500 | $218,400 |
| 2023 | $4,266 | $448,100 | $204,100 | $244,000 |
| 2022 | $4,058 | $401,800 | $182,200 | $219,600 |
| 2021 | $3,537 | $337,200 | $165,700 | $171,500 |
| 2020 | $3,384 | $315,100 | $165,700 | $149,400 |
| 2019 | $3,392 | $308,100 | $165,700 | $142,400 |
| 2018 | $3,376 | $294,600 | $150,600 | $144,000 |
| 2017 | $3,076 | $261,600 | $150,600 | $111,000 |
| 2016 | $2,963 | $248,600 | $150,600 | $98,000 |
| 2015 | $2,691 | $218,800 | $146,800 | $72,000 |
Source: Public Records
Map
Nearby Homes
- 3 Margaret Rd
- 6 Allen Rd
- 38 Longview Way
- 26 Bartholomew Terrace
- 12 Tara Rd
- 22 Strongwater Dr
- 18 Strongwater Dr
- 11 Strongwater Dr
- 18 1/2 Dalton Ct Unit 18 1/2
- 111 Foster St Unit 416
- 176 Marlborough Rd
- 98 Foster St
- 80 Foster St Unit 501
- 80 Foster St Unit 507
- 2 Lions Ln Unit 2
- 43 Gedney Dr
- 64 Foster St Unit 403
- 6 Rear Perkins St
- 38-1/2 Ellsworth Rd
- 11 Pulver Dr
Your Personal Tour Guide
Ask me questions while you tour the home.