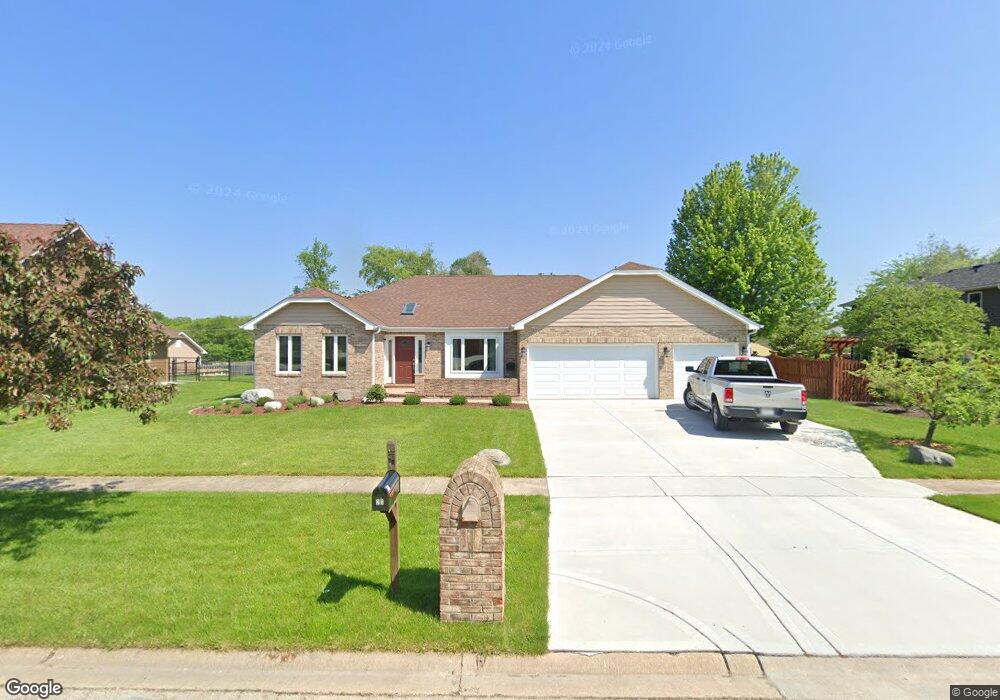
17 Robert Rd Oswego, IL 60543
South Oswego NeighborhoodEstimated Value: $436,000 - $515,000
3
Beds
4
Baths
2,438
Sq Ft
$198/Sq Ft
Est. Value
About This Home
This home is located at 17 Robert Rd, Oswego, IL 60543 and is currently estimated at $481,644, approximately $197 per square foot. 17 Robert Rd is a home located in Kendall County with nearby schools including Southbury Elementary School, Traughber Junior High School, and Oswego High School.
Ownership History
Date
Name
Owned For
Owner Type
Purchase Details
Closed on
Dec 11, 2020
Sold by
Mou Aijun and Ansell Mou Family Revocable Tr
Bought by
Mou Aijun and Aijun Mou Revocable Trust
Current Estimated Value
Purchase Details
Closed on
Jun 29, 2015
Sold by
Mou Aijun
Bought by
Mou Aijun
Purchase Details
Closed on
Oct 1, 2010
Sold by
Phillips Roger N and Phillips Shirley
Bought by
Ansell Michael P and Mou Aijun
Home Financials for this Owner
Home Financials are based on the most recent Mortgage that was taken out on this home.
Original Mortgage
$212,143
Outstanding Balance
$139,278
Interest Rate
4.25%
Mortgage Type
FHA
Estimated Equity
$342,366
Purchase Details
Closed on
Jan 1, 1993
Bought by
Phillips Roger N
Purchase Details
Closed on
Jul 1, 1990
Bought by
Zipoli Thomas M
Purchase Details
Closed on
Jan 1, 1990
Bought by
Wohead Steve
Create a Home Valuation Report for This Property
The Home Valuation Report is an in-depth analysis detailing your home's value as well as a comparison with similar homes in the area
Home Values in the Area
Average Home Value in this Area
Purchase History
We collect this data history from publicly available records. To have your information removed, we recommend requesting removal directly through your county’s website.
| Date | Buyer | Sale Price | Title Company |
|---|---|---|---|
| Mou Aijun | -- | Attorneys Ttl Guaranty Fund | |
| Mou Aijun | -- | None Available | |
| Ansell Michael P | $215,000 | Attorneys Title Guaranty Fun | |
| Phillips Roger N | $195,000 | -- | |
| Zipoli Thomas M | $196,000 | -- | |
| Wohead Steve | $35,000 | -- |
Source: Public Records
Mortgage History
We collect this data history from publicly available records. To have your information removed, we recommend requesting removal directly through your county’s website.
| Date | Status | Borrower | Loan Amount |
|---|---|---|---|
| Open | Ansell Michael P | $212,143 | |
| Closed | Wohead Steve | -- |
Source: Public Records
Tax History
| Year | Tax Paid | Tax Assessment Tax Assessment Total Assessment is a certain percentage of the fair market value that is determined by local assessors to be the total taxable value of land and additions on the property. | Land | Improvement |
|---|---|---|---|---|
| 2024 | $10,293 | $133,906 | $26,823 | $107,083 |
| 2023 | $9,361 | $120,636 | $24,165 | $96,471 |
| 2022 | $9,361 | $109,669 | $21,968 | $87,701 |
| 2021 | $9,499 | $107,518 | $21,537 | $85,981 |
| 2020 | $9,592 | $107,518 | $21,537 | $85,981 |
| 2019 | $9,427 | $104,211 | $21,537 | $82,674 |
| 2018 | $5,118 | $101,868 | $21,053 | $80,815 |
| 2017 | $9,426 | $97,950 | $20,243 | $77,707 |
| 2016 | $9,033 | $92,844 | $19,188 | $73,656 |
| 2015 | $8,900 | $87,589 | $18,102 | $69,487 |
| 2014 | -- | $84,220 | $17,406 | $66,814 |
| 2013 | -- | $85,071 | $17,582 | $67,489 |
Source: Public Records
Map
Nearby Homes
- 8 Hawthorne Dr
- 300 Winthrop Dr
- 836 Colchester Dr
- 3 Orchard Rd
- 123 Orchard Rd
- 2 Orchard Rd
- 1300 Orchard Rd
- 1451 Vintage Dr
- 122 Cinderford Ct
- 215 Willington Way
- 704 Pomfret Ct
- 816 Colchester Dr
- 703 Pomfret Ct
- 420 Bower Ln
- 705 Pomfret Ct
- 422 Bower Ln
- 860 Preston Ln
- 739 Alberta Ave
- 743 Alberta Ave
- 710 Springside Ct
Your Personal Tour Guide
Ask me questions while you tour the home.