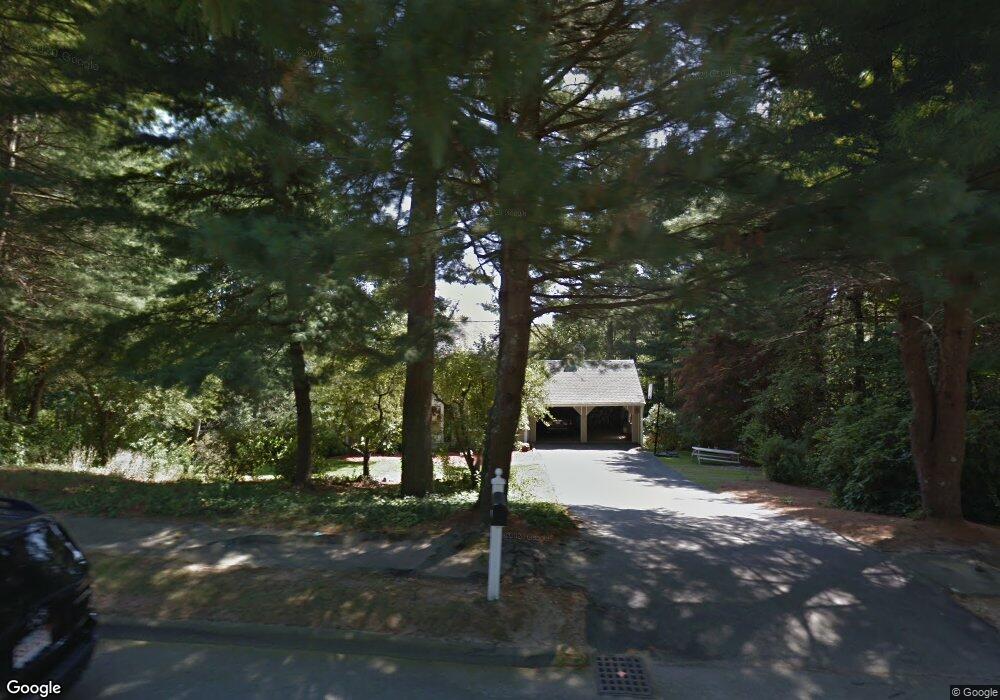
17 Tophet Rd Lynnfield, MA 01940
Estimated Value: $1,186,000 - $1,356,000
4
Beds
4
Baths
2,875
Sq Ft
$446/Sq Ft
Est. Value
About This Home
This home is located at 17 Tophet Rd, Lynnfield, MA 01940 and is currently estimated at $1,283,370, approximately $446 per square foot. 17 Tophet Rd is a home located in Essex County with nearby schools including Lynnfield Middle School, Lynnfield High School, and Odyssey Day School.
Ownership History
Date
Name
Owned For
Owner Type
Purchase Details
Closed on
Mar 20, 1998
Sold by
Burden Douglas B and Burden Patricia M
Bought by
Silacci Gary E and Silacci Kimberly
Current Estimated Value
Purchase Details
Closed on
May 15, 1990
Sold by
Gebhardt Frederick G
Bought by
Burden Patricia M
Create a Home Valuation Report for This Property
The Home Valuation Report is an in-depth analysis detailing your home's value as well as a comparison with similar homes in the area
Home Values in the Area
Average Home Value in this Area
Purchase History
| Date | Buyer | Sale Price | Title Company |
|---|---|---|---|
| Silacci Gary E | $362,000 | -- | |
| Burden Patricia M | $310,000 | -- |
Source: Public Records
Mortgage History
| Date | Status | Borrower | Loan Amount |
|---|---|---|---|
| Closed | Burden Patricia M | $368,000 | |
| Closed | Burden Patricia M | $404,000 |
Source: Public Records
Tax History
| Year | Tax Paid | Tax Assessment Tax Assessment Total Assessment is a certain percentage of the fair market value that is determined by local assessors to be the total taxable value of land and additions on the property. | Land | Improvement |
|---|---|---|---|---|
| 2025 | $12,041 | $1,140,200 | $731,000 | $409,200 |
| 2024 | $11,635 | $1,107,000 | $709,700 | $397,300 |
| 2023 | $11,059 | $978,700 | $629,000 | $349,700 |
| 2022 | $10,599 | $884,000 | $588,600 | $295,400 |
| 2021 | $9,682 | $729,600 | $447,300 | $282,300 |
| 2020 | $9,622 | $691,200 | $407,000 | $284,200 |
| 2019 | $9,615 | $691,200 | $407,000 | $284,200 |
| 2018 | $9,511 | $691,200 | $407,000 | $284,200 |
| 2017 | $9,441 | $685,100 | $400,900 | $284,200 |
| 2016 | $8,790 | $606,200 | $336,300 | $269,900 |
| 2015 | $8,778 | $605,800 | $335,900 | $269,900 |
Source: Public Records
Map
Nearby Homes
- 25 Apple Hill Ln
- 415 Lowell St
- 2 Bridle Path
- 3 Willard Ln
- 15 Park St Unit A
- 15 Park St Unit B
- 15 Park St
- 4 Hickory Ln
- 9 Oxbow Rd
- 35 Lincoln Ave
- 15 Fairway Ln Unit 55
- 15 Fairway Ln
- 10 Fairway Ln
- 17 Marshall St
- 19 Fairway Ln Unit 53
- 1 Stableford Ct Unit 13
- 5 Stableford Ct Unit 11
- 18 Heritage Ln
- 7 Stableford Ct Unit 10
- 9 Stableford Ct Unit 9
Your Personal Tour Guide
Ask me questions while you tour the home.