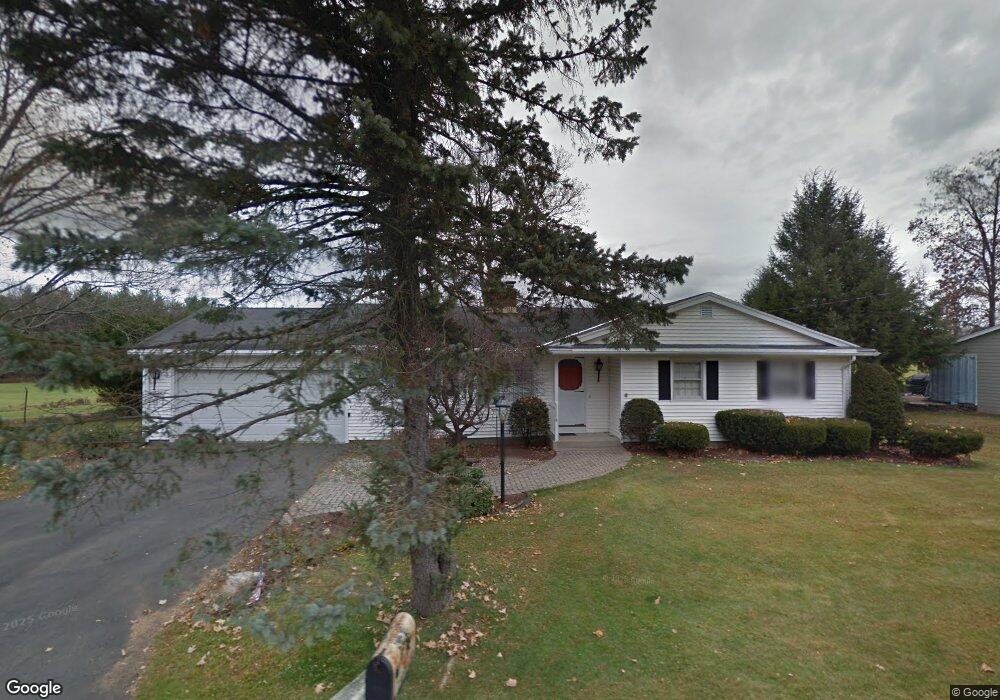
17 Truehart Dr Easthampton, MA 01027
Estimated Value: $368,000 - $415,114
3
Beds
2
Baths
1,248
Sq Ft
$317/Sq Ft
Est. Value
About This Home
This home is located at 17 Truehart Dr, Easthampton, MA 01027 and is currently estimated at $396,029, approximately $317 per square foot. 17 Truehart Dr is a home located in Hampshire County with nearby schools including Easthampton High School, Hilltown Cooperative Charter Public School, and Calvary Baptist Christian School.
Ownership History
Date
Name
Owned For
Owner Type
Purchase Details
Closed on
Oct 20, 2023
Sold by
Grace Timothy J
Bought by
Grace Timothy J and Grace Sage H
Current Estimated Value
Purchase Details
Closed on
Oct 22, 2013
Sold by
Rogozinski Susan M
Bought by
Rogozinski Susan M and Rogozinski Richard M
Create a Home Valuation Report for This Property
The Home Valuation Report is an in-depth analysis detailing your home's value as well as a comparison with similar homes in the area
Home Values in the Area
Average Home Value in this Area
Purchase History
| Date | Buyer | Sale Price | Title Company |
|---|---|---|---|
| Grace Timothy J | -- | None Available | |
| Rogozinski Susan M | -- | -- |
Source: Public Records
Tax History Compared to Growth
Tax History
| Year | Tax Paid | Tax Assessment Tax Assessment Total Assessment is a certain percentage of the fair market value that is determined by local assessors to be the total taxable value of land and additions on the property. | Land | Improvement |
|---|---|---|---|---|
| 2025 | $4,666 | $341,300 | $118,600 | $222,700 |
| 2024 | $4,505 | $332,200 | $115,200 | $217,000 |
| 2023 | $3,419 | $233,400 | $90,700 | $142,700 |
| 2022 | $3,858 | $233,400 | $90,700 | $142,700 |
| 2021 | $4,218 | $240,500 | $90,700 | $149,800 |
| 2020 | $4,145 | $233,400 | $90,700 | $142,700 |
| 2019 | $3,475 | $224,800 | $90,700 | $134,100 |
| 2018 | $3,333 | $208,300 | $85,600 | $122,700 |
| 2017 | $3,252 | $200,600 | $82,200 | $118,400 |
| 2016 | $3,127 | $200,600 | $82,200 | $118,400 |
| 2015 | $3,039 | $200,600 | $82,200 | $118,400 |
Source: Public Records
Map
Nearby Homes