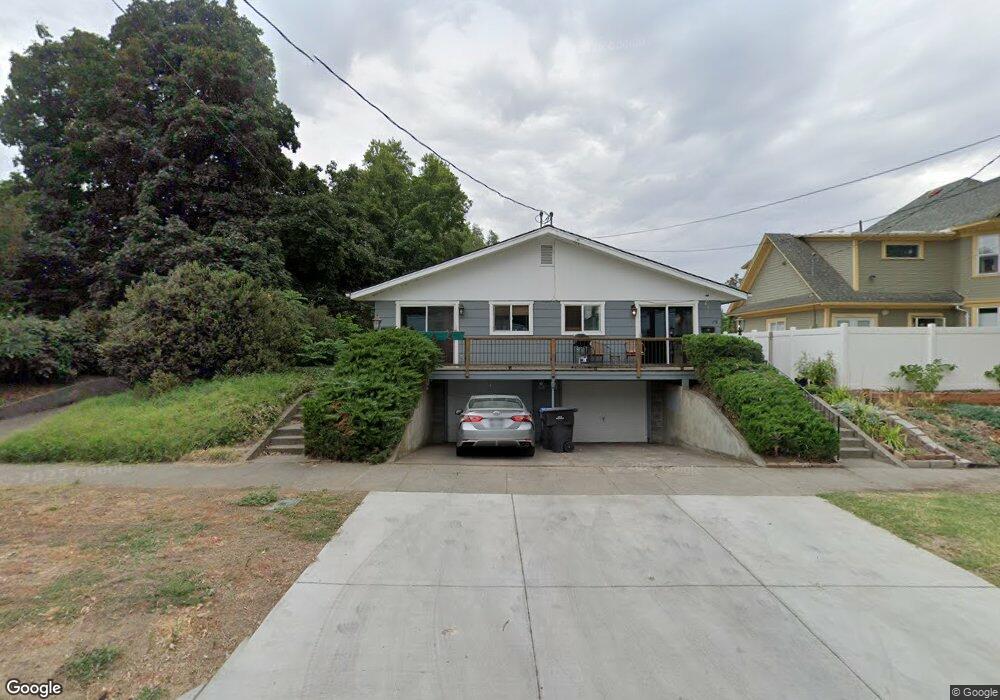
17 W Walnut St Unit 19 Walla Walla, WA 99362
Estimated Value: $336,000 - $425,000
4
Beds
2
Baths
1,656
Sq Ft
$230/Sq Ft
Est. Value
About This Home
This home is located at 17 W Walnut St Unit 19, Walla Walla, WA 99362 and is currently estimated at $380,500, approximately $229 per square foot. 17 W Walnut St Unit 19 is a home located in Walla Walla County with nearby schools including Sharpstein Elementary School, Garrison Middle School, and Willow Public School.
Ownership History
Date
Name
Owned For
Owner Type
Purchase Details
Closed on
Jun 26, 2020
Sold by
Saturno Douglas Breen and Saturno Malinda Mckee
Bought by
Saturno Residential Holdings Llc
Current Estimated Value
Purchase Details
Closed on
Dec 15, 2008
Sold by
Aurora Loan Services Llc
Bought by
Mckee Saturno Douglas Breen and Mckee Saturno Malinda
Purchase Details
Closed on
Jul 18, 2008
Sold by
Snow Mark B
Bought by
Aurora Loan Services Llc
Purchase Details
Closed on
Aug 18, 2006
Sold by
Zbaraschuk Korey L
Bought by
Snow Mark B
Home Financials for this Owner
Home Financials are based on the most recent Mortgage that was taken out on this home.
Original Mortgage
$160,000
Interest Rate
8.25%
Mortgage Type
Commercial
Create a Home Valuation Report for This Property
The Home Valuation Report is an in-depth analysis detailing your home's value as well as a comparison with similar homes in the area
Home Values in the Area
Average Home Value in this Area
Purchase History
| Date | Buyer | Sale Price | Title Company |
|---|---|---|---|
| Saturno Residential Holdings Llc | -- | None Available | |
| Mckee Saturno Douglas Breen | $139,900 | None Available | |
| Aurora Loan Services Llc | $180,184 | None Available | |
| Snow Mark B | $239,215 | Walla Walla Title Company |
Source: Public Records
Mortgage History
| Date | Status | Borrower | Loan Amount |
|---|---|---|---|
| Previous Owner | Snow Mark B | $160,000 |
Source: Public Records
Tax History Compared to Growth
Tax History
| Year | Tax Paid | Tax Assessment Tax Assessment Total Assessment is a certain percentage of the fair market value that is determined by local assessors to be the total taxable value of land and additions on the property. | Land | Improvement |
|---|---|---|---|---|
| 2024 | $2,098 | $261,300 | $45,000 | $216,300 |
| 2023 | $2,098 | $236,830 | $26,250 | $210,580 |
| 2022 | $2,040 | $236,830 | $26,250 | $210,580 |
| 2021 | $1,927 | $188,240 | $26,250 | $161,990 |
| 2020 | $1,905 | $161,240 | $26,250 | $134,990 |
| 2019 | $1,743 | $161,240 | $26,250 | $134,990 |
| 2018 | $2,095 | $161,240 | $26,250 | $134,990 |
| 2017 | $1,799 | $158,700 | $30,000 | $128,700 |
| 2016 | $1,891 | $147,000 | $30,000 | $117,000 |
| 2015 | $1,850 | $147,000 | $30,000 | $117,000 |
| 2014 | -- | $147,000 | $30,000 | $117,000 |
| 2013 | -- | $147,000 | $30,000 | $117,000 |
Source: Public Records
Map
Nearby Homes