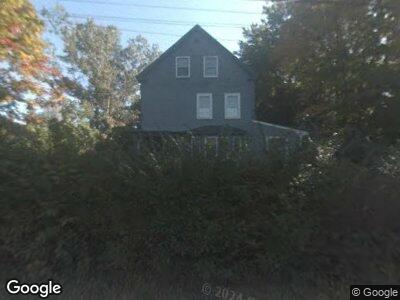
170 Central St Georgetown, MA 01833
Estimated Value: $655,850 - $790,000
4
Beds
3
Baths
2,559
Sq Ft
$284/Sq Ft
Est. Value
About This Home
This home is located at 170 Central St, Georgetown, MA 01833 and is currently estimated at $726,963, approximately $284 per square foot. 170 Central St is a home located in Essex County with nearby schools including Perley Elementary School, Penn Brook School, and Georgetown High School.
Ownership History
Date
Name
Owned For
Owner Type
Purchase Details
Closed on
Mar 21, 2024
Sold by
Greene Lisa and Greene Shawn E
Bought by
Greene
Current Estimated Value
Purchase Details
Closed on
Oct 30, 1997
Sold by
Swenson Carl John and Swenson Langmaid-Swenson L
Bought by
Greene Shawn E and Greene Lisa
Purchase Details
Closed on
Jul 22, 1991
Sold by
Randall Dorothy L and Randall Milton A
Bought by
Swenson Carl J and Swenson Lauren L
Create a Home Valuation Report for This Property
The Home Valuation Report is an in-depth analysis detailing your home's value as well as a comparison with similar homes in the area
Home Values in the Area
Average Home Value in this Area
Purchase History
| Date | Buyer | Sale Price | Title Company |
|---|---|---|---|
| Greene | -- | None Available | |
| Greene | -- | None Available | |
| Greene Shawn E | $165,000 | -- | |
| Swenson Carl J | $139,500 | -- | |
| Greene Shawn E | $165,000 | -- | |
| Swenson Carl J | $139,500 | -- |
Source: Public Records
Mortgage History
| Date | Status | Borrower | Loan Amount |
|---|---|---|---|
| Previous Owner | Greene Lisa A | $111,200 | |
| Previous Owner | Randall Milton | $312,000 | |
| Previous Owner | Randall Milton | $264,000 | |
| Previous Owner | Randall Milton | $204,000 |
Source: Public Records
Tax History Compared to Growth
Tax History
| Year | Tax Paid | Tax Assessment Tax Assessment Total Assessment is a certain percentage of the fair market value that is determined by local assessors to be the total taxable value of land and additions on the property. | Land | Improvement |
|---|---|---|---|---|
| 2025 | $7,345 | $664,100 | $281,300 | $382,800 |
| 2024 | $6,336 | $504,900 | $194,500 | $310,400 |
| 2023 | $6,166 | $475,000 | $194,500 | $280,500 |
| 2022 | $6,221 | $441,800 | $169,300 | $272,500 |
| 2021 | $5,660 | $356,200 | $169,300 | $186,900 |
| 2020 | $5,671 | $356,200 | $169,300 | $186,900 |
| 2019 | $5,433 | $344,300 | $166,100 | $178,200 |
| 2018 | $5,467 | $344,300 | $166,100 | $178,200 |
| 2017 | $5,468 | $337,300 | $166,100 | $171,200 |
| 2016 | $5,020 | $316,300 | $166,100 | $150,200 |
| 2015 | $5,051 | $315,100 | $166,100 | $149,000 |
| 2014 | $4,526 | $322,100 | $166,100 | $156,000 |
Source: Public Records
Map
Nearby Homes