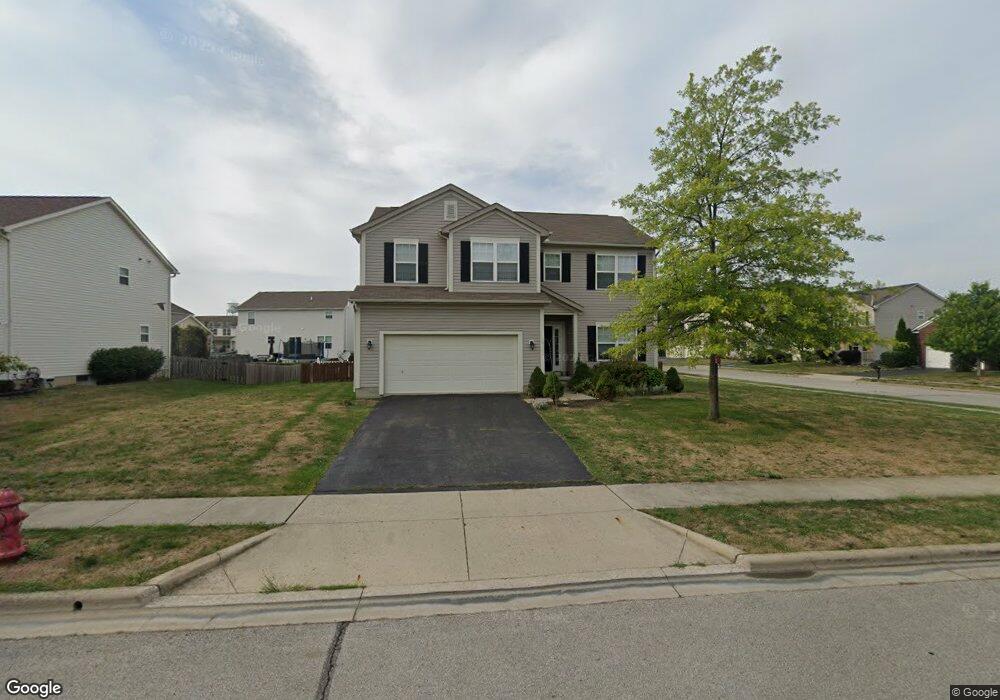
170 Cherrytree Ln Commercial Point, OH 43116
Estimated Value: $384,802 - $400,000
4
Beds
3
Baths
2,382
Sq Ft
$165/Sq Ft
Est. Value
About This Home
This home is located at 170 Cherrytree Ln, Commercial Point, OH 43116 and is currently estimated at $394,201, approximately $165 per square foot. 170 Cherrytree Ln is a home located in Pickaway County.
Ownership History
Date
Name
Owned For
Owner Type
Purchase Details
Closed on
Jul 5, 2017
Sold by
Balzer Rodney A
Bought by
Ah4r Properities Llc
Current Estimated Value
Purchase Details
Closed on
Jun 24, 2017
Sold by
Balzer Rodney A
Bought by
Ah4r Properties Llc
Purchase Details
Closed on
Jul 14, 2006
Sold by
Westport Homes Of Ohio Inc
Bought by
Balzer Rodney A and Balzer Christine A
Home Financials for this Owner
Home Financials are based on the most recent Mortgage that was taken out on this home.
Original Mortgage
$207,571
Interest Rate
6.73%
Mortgage Type
FHA
Purchase Details
Closed on
May 26, 2006
Sold by
Westport Property Group Llc
Bought by
Westport Homes Of Ohio Inc
Home Financials for this Owner
Home Financials are based on the most recent Mortgage that was taken out on this home.
Original Mortgage
$207,571
Interest Rate
6.73%
Mortgage Type
FHA
Create a Home Valuation Report for This Property
The Home Valuation Report is an in-depth analysis detailing your home's value as well as a comparison with similar homes in the area
Home Values in the Area
Average Home Value in this Area
Purchase History
| Date | Buyer | Sale Price | Title Company |
|---|---|---|---|
| Ah4r Properities Llc | $193,000 | None Available | |
| Ah4r Properties Llc | $193,000 | None Available | |
| Balzer Rodney A | $209,300 | The Talon Group | |
| Westport Homes Of Ohio Inc | $232,000 | The Talon Group |
Source: Public Records
Mortgage History
| Date | Status | Borrower | Loan Amount |
|---|---|---|---|
| Previous Owner | Balzer Rodney A | $207,571 |
Source: Public Records
Tax History Compared to Growth
Tax History
| Year | Tax Paid | Tax Assessment Tax Assessment Total Assessment is a certain percentage of the fair market value that is determined by local assessors to be the total taxable value of land and additions on the property. | Land | Improvement |
|---|---|---|---|---|
| 2024 | -- | $111,460 | $18,390 | $93,070 |
| 2023 | $4,192 | $111,460 | $18,390 | $93,070 |
| 2022 | $3,798 | $92,750 | $15,320 | $77,430 |
| 2021 | $3,809 | $92,750 | $15,320 | $77,430 |
| 2020 | $3,810 | $92,750 | $15,320 | $77,430 |
| 2019 | $2,953 | $75,030 | $15,320 | $59,710 |
| 2018 | $2,924 | $75,030 | $15,320 | $59,710 |
| 2017 | $3,001 | $75,030 | $15,320 | $59,710 |
| 2016 | $2,731 | $68,140 | $11,710 | $56,430 |
| 2015 | $2,733 | $68,140 | $11,710 | $56,430 |
| 2014 | $2,736 | $68,140 | $11,710 | $56,430 |
| 2013 | $2,895 | $69,330 | $11,710 | $57,620 |
Source: Public Records
Map
Nearby Homes
- 161 Chestnut Estates Dr
- 169 Chestnut Commons Dr
- 186 Red Oak Ct
- 182 Honey Locust Ln
- 166 Rosewood Loop SE
- 11044 Coontz Rd
- 7789 State Route 762
- 56 Chambers Bay Rd
- 294 Shady Hollow Dr
- 47 Front St
- 66 Genoa Cir
- 62 Genoa Cir
- The Siebert Plan at Genoa Crossing
- The Hollandia B Plan at Genoa Crossing
- The Rainier Plan at Genoa Crossing
- The Petoskey Plan at Genoa Crossing
- 55 Genoa Cir
- 310 Genoa Rd
- 0 Lane Rd Unit 225004404
- 45 Genoa Cir
- 172 Cherrytree Ln
- 193 Cherrytree Ln
- 193 Cherry Tree Ln
- 203 Cherrytree Ln
- 190 Cherry Tree Ln
- 174 Cherrytree Ln
- 169 Cherrytree Ln
- 192 Cherrytree Ln
- 171 Cherrytree Ln
- 205 Cherrytree Ln
- 194 Cherrytree Ln
- 190 Cherrytree Ln
- 173 Cherry Tree Ln
- 188 Cherrytree Ln
- 173 Cherrytree Ln
- 176 Cherrytree Ln
- 186 Cherry Tree Ln
- 207 Cherrytree Ln
- 196 Cherrytree Ln
- 186 Cherrytree Ln