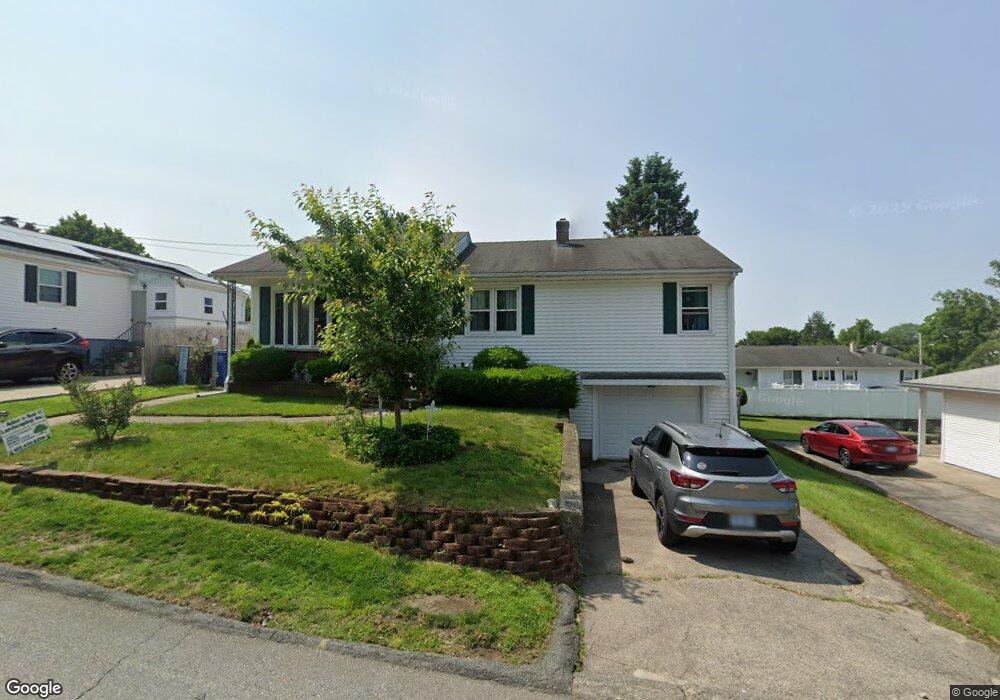
170 Elwyn St Cranston, RI 02920
Laurel Hill NeighborhoodEstimated Value: $394,000 - $419,000
3
Beds
2
Baths
1,944
Sq Ft
$206/Sq Ft
Est. Value
About This Home
This home is located at 170 Elwyn St, Cranston, RI 02920 and is currently estimated at $400,725, approximately $206 per square foot. 170 Elwyn St is a home located in Providence County with nearby schools including Hugh B. Bain Middle School, Cranston High School East, and Achievement First Iluminar Mayoral Academy.
Ownership History
Date
Name
Owned For
Owner Type
Purchase Details
Closed on
Nov 6, 2009
Sold by
Patrizio Nancy
Bought by
Almonte Susann
Current Estimated Value
Home Financials for this Owner
Home Financials are based on the most recent Mortgage that was taken out on this home.
Original Mortgage
$171,830
Outstanding Balance
$112,088
Interest Rate
5.06%
Mortgage Type
Purchase Money Mortgage
Estimated Equity
$288,637
Create a Home Valuation Report for This Property
The Home Valuation Report is an in-depth analysis detailing your home's value as well as a comparison with similar homes in the area
Home Values in the Area
Average Home Value in this Area
Purchase History
| Date | Buyer | Sale Price | Title Company |
|---|---|---|---|
| Almonte Susann | $175,000 | -- |
Source: Public Records
Mortgage History
| Date | Status | Borrower | Loan Amount |
|---|---|---|---|
| Open | Almonte Susann | $171,830 |
Source: Public Records
Tax History Compared to Growth
Tax History
| Year | Tax Paid | Tax Assessment Tax Assessment Total Assessment is a certain percentage of the fair market value that is determined by local assessors to be the total taxable value of land and additions on the property. | Land | Improvement |
|---|---|---|---|---|
| 2025 | $4,245 | $305,800 | $89,000 | $216,800 |
| 2024 | $4,162 | $305,800 | $89,000 | $216,800 |
| 2023 | $4,169 | $220,600 | $61,400 | $159,200 |
| 2022 | $4,083 | $220,600 | $61,400 | $159,200 |
| 2021 | $3,971 | $220,600 | $61,400 | $159,200 |
| 2020 | $3,500 | $168,500 | $47,800 | $120,700 |
| 2019 | $3,500 | $168,500 | $47,800 | $120,700 |
| 2018 | $3,419 | $168,500 | $47,800 | $120,700 |
| 2017 | $3,207 | $139,800 | $37,500 | $102,300 |
| 2016 | $3,139 | $139,800 | $37,500 | $102,300 |
| 2015 | $3,139 | $139,800 | $37,500 | $102,300 |
| 2014 | $3,079 | $134,800 | $37,500 | $97,300 |
Source: Public Records
Map
Nearby Homes
- 140 Lawrence St Unit 142
- 318 Princess Ave
- 0 Princess Ave
- 92 Old Oak Ave
- 127 Gladstone St
- 95 Elwyn St
- 443 Dyer Ave
- 147 Wales St
- 87 Dunedin St
- 32 Maplewood Ave
- 121 Heather St
- 52 Sumner Ave
- 17 Birch St
- 24-26 Pendleton St
- 26 Alto St
- 161 Prudence Ave
- 1303 Cranston St
- 1250 Cranston St
- 372 Farmington Ave
- 454 Union Ave