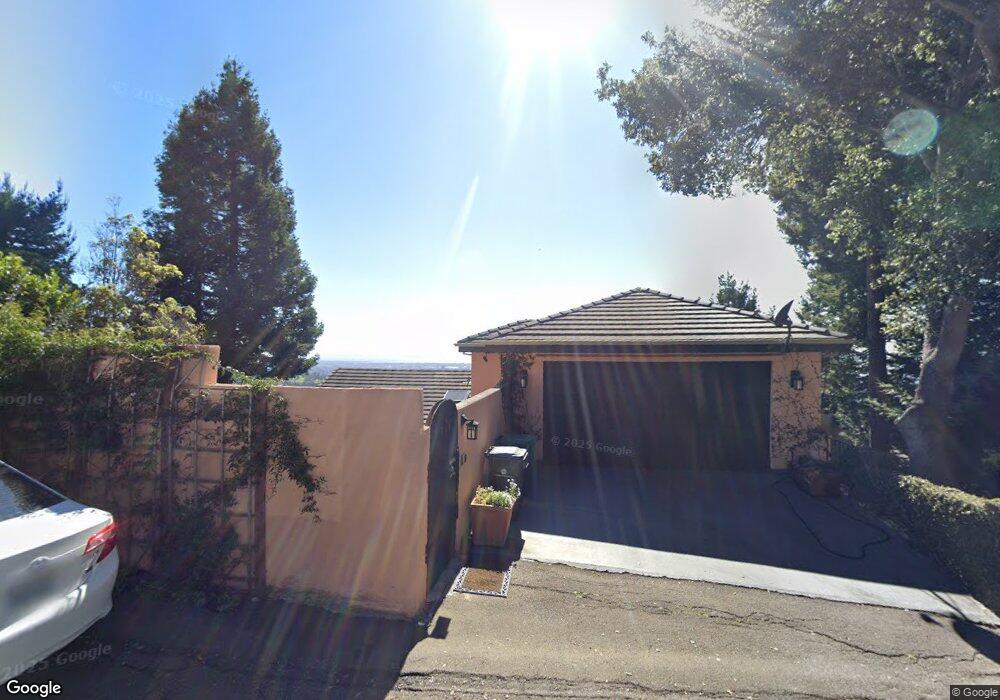
170 Gravatt Dr Berkeley, CA 94705
Claremont Hills NeighborhoodEstimated Value: $2,195,000 - $2,420,000
3
Beds
4
Baths
3,708
Sq Ft
$622/Sq Ft
Est. Value
About This Home
This home is located at 170 Gravatt Dr, Berkeley, CA 94705 and is currently estimated at $2,306,546, approximately $622 per square foot. 170 Gravatt Dr is a home located in Alameda County with nearby schools including Chabot Elementary School, Thornhill Elementary School, and Claremont Middle School.
Ownership History
Date
Name
Owned For
Owner Type
Purchase Details
Closed on
Apr 16, 2021
Sold by
Anderson Eric Paul
Bought by
Anderson Eric Paul and Griego Estevan Luciano
Current Estimated Value
Purchase Details
Closed on
Nov 4, 1997
Sold by
Wong Jung Ok
Bought by
Anderson Eric P
Home Financials for this Owner
Home Financials are based on the most recent Mortgage that was taken out on this home.
Original Mortgage
$365,000
Outstanding Balance
$59,796
Interest Rate
7.26%
Estimated Equity
$2,246,750
Purchase Details
Closed on
Apr 11, 1995
Sold by
Ringering Robert L and Ringering Joanne
Bought by
Won Jung Ok
Home Financials for this Owner
Home Financials are based on the most recent Mortgage that was taken out on this home.
Original Mortgage
$484,250
Interest Rate
8.6%
Create a Home Valuation Report for This Property
The Home Valuation Report is an in-depth analysis detailing your home's value as well as a comparison with similar homes in the area
Home Values in the Area
Average Home Value in this Area
Purchase History
| Date | Buyer | Sale Price | Title Company |
|---|---|---|---|
| Anderson Eric Paul | -- | None Available | |
| Anderson Eric Paul | -- | None Available | |
| Anderson Eric P | $795,000 | Chicago Title Co | |
| Won Jung Ok | $745,000 | -- |
Source: Public Records
Mortgage History
| Date | Status | Borrower | Loan Amount |
|---|---|---|---|
| Open | Anderson Eric P | $365,000 | |
| Previous Owner | Won Jung Ok | $484,250 |
Source: Public Records
Tax History
| Year | Tax Paid | Tax Assessment Tax Assessment Total Assessment is a certain percentage of the fair market value that is determined by local assessors to be the total taxable value of land and additions on the property. | Land | Improvement |
|---|---|---|---|---|
| 2025 | $17,816 | $1,261,872 | $380,805 | $888,067 |
| 2024 | $17,816 | $1,236,998 | $373,340 | $870,658 |
| 2023 | $18,785 | $1,219,610 | $366,021 | $853,589 |
| 2022 | $18,461 | $1,188,696 | $358,844 | $836,852 |
| 2021 | $17,930 | $1,165,253 | $351,808 | $820,445 |
| 2020 | $17,729 | $1,160,237 | $348,202 | $812,035 |
| 2019 | $17,181 | $1,137,492 | $341,376 | $796,116 |
| 2018 | $16,819 | $1,115,193 | $334,684 | $780,509 |
| 2017 | $16,215 | $1,093,331 | $328,123 | $765,208 |
| 2016 | $15,794 | $1,071,899 | $321,691 | $750,208 |
| 2015 | $15,706 | $1,055,798 | $316,859 | $738,939 |
| 2014 | $15,809 | $1,035,120 | $310,653 | $724,467 |
Source: Public Records
Map
Nearby Homes
- 260 Alvarado Rd
- 142 Gravatt Dr
- 150 Vicente Rd
- 0 Gravatt Dr Unit 41122154
- 2 Gravatt Dr
- 641 Alvarado Rd
- 29 Live Oak Rd
- 1488 Alvarado Rd
- 1426 Grand View Dr
- 1102 Grand View Dr
- 0 Tunnel Rd
- 0 Dartmouth Dr
- 1215 Alvarado Rd
- 7723 Claremont Ave
- 190 Stonewall Rd
- 204 El Camino Real
- 1375 Alvarado Rd
- 1383 Alvarado Rd
- 0 Gypsy Ln
- 1881 Grand View Dr
- 160 Gravatt Dr
- 188 Gravatt Dr
- 258 Alvarado Rd
- 225 Gravatt Dr
- 245 Gravatt Dr
- 217 Gravatt Dr
- 209 Gravatt Dr
- 262 Alvarado Rd
- 201 Gravatt Dr
- 251 Gravatt Dr
- 218 Gravatt Dr
- 128 Gravatt Dr
- 259 Gravatt Dr
- 256 Alvarado Rd
- 256 Alvarado Rd
- 222 Gravatt Dr
- 267 Gravatt Dr
- 138 Gravatt Dr
- 242 Gravatt Dr
- 252 Alvarado Rd
Your Personal Tour Guide
Ask me questions while you tour the home.