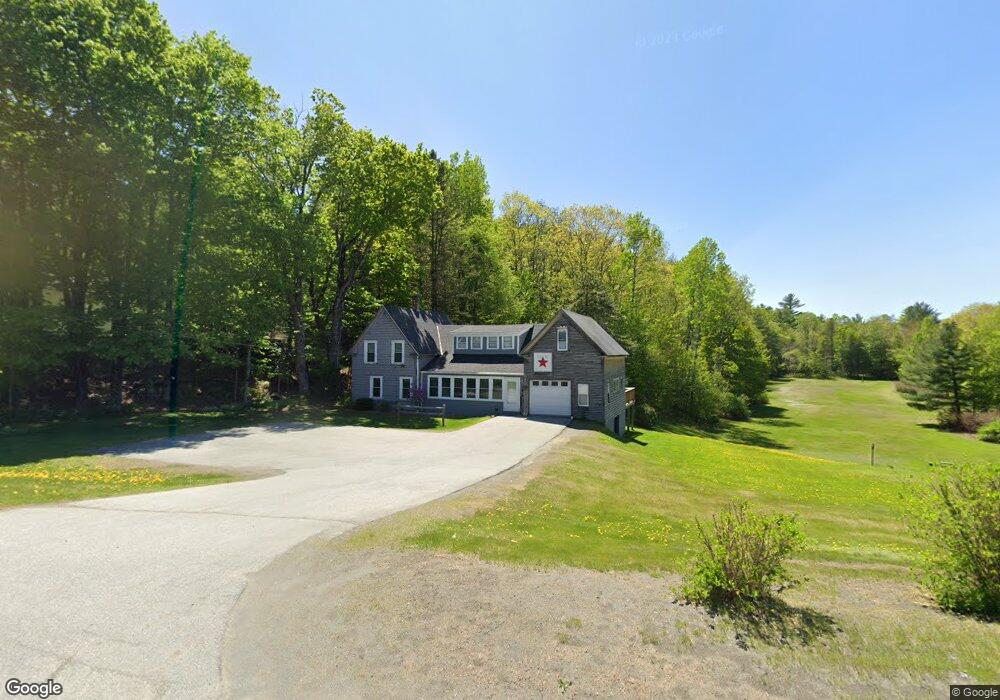
170 Main Rd Sangerville, ME 04479
Estimated Value: $254,000
--
Bed
--
Bath
--
Sq Ft
4.3
Acres
About This Home
This home is located at 170 Main Rd, Sangerville, ME 04479 and is currently estimated at $254,000. 170 Main Rd is a home with nearby schools including Piscataquis Community Elementary School and Piscataquis Community Secondary School.
Ownership History
Date
Name
Owned For
Owner Type
Purchase Details
Closed on
Oct 9, 2025
Sold by
Jordan Gregory A and Jordan Beverly A
Bought by
Ray Christopher and Hartwell Austin
Current Estimated Value
Home Financials for this Owner
Home Financials are based on the most recent Mortgage that was taken out on this home.
Original Mortgage
$239,926
Outstanding Balance
$239,712
Interest Rate
6.56%
Mortgage Type
FHA
Estimated Equity
$14,288
Purchase Details
Closed on
May 19, 2016
Sold by
Schmiedlehner Paul and Jordan Gregory A
Bought by
Cartwright James F
Create a Home Valuation Report for This Property
The Home Valuation Report is an in-depth analysis detailing your home's value as well as a comparison with similar homes in the area
Home Values in the Area
Average Home Value in this Area
Purchase History
| Date | Buyer | Sale Price | Title Company |
|---|---|---|---|
| Ray Christopher | $262,000 | -- | |
| Cartwright James F | -- | -- | |
| Cartwright James F | -- | -- |
Source: Public Records
Mortgage History
| Date | Status | Borrower | Loan Amount |
|---|---|---|---|
| Open | Ray Christopher | $239,926 |
Source: Public Records
Tax History Compared to Growth
Tax History
| Year | Tax Paid | Tax Assessment Tax Assessment Total Assessment is a certain percentage of the fair market value that is determined by local assessors to be the total taxable value of land and additions on the property. | Land | Improvement |
|---|---|---|---|---|
| 2024 | $1,316 | $110,840 | $29,870 | $80,970 |
| 2023 | $1,213 | $65,730 | $21,870 | $43,860 |
| 2022 | $1,048 | $65,730 | $21,870 | $43,860 |
| 2021 | $1,094 | $65,730 | $21,870 | $43,860 |
| 2020 | $1,107 | $65,730 | $21,870 | $43,860 |
| 2019 | $1,209 | $65,730 | $21,870 | $43,860 |
| 2018 | $1,219 | $65,730 | $21,870 | $43,860 |
| 2017 | $1,249 | $65,730 | $21,870 | $43,860 |
| 2016 | $1,249 | $65,730 | $21,870 | $43,860 |
| 2015 | $1,216 | $65,730 | $21,870 | $43,860 |
| 2014 | $1,163 | $65,730 | $21,870 | $43,860 |
Source: Public Records
Map
Nearby Homes