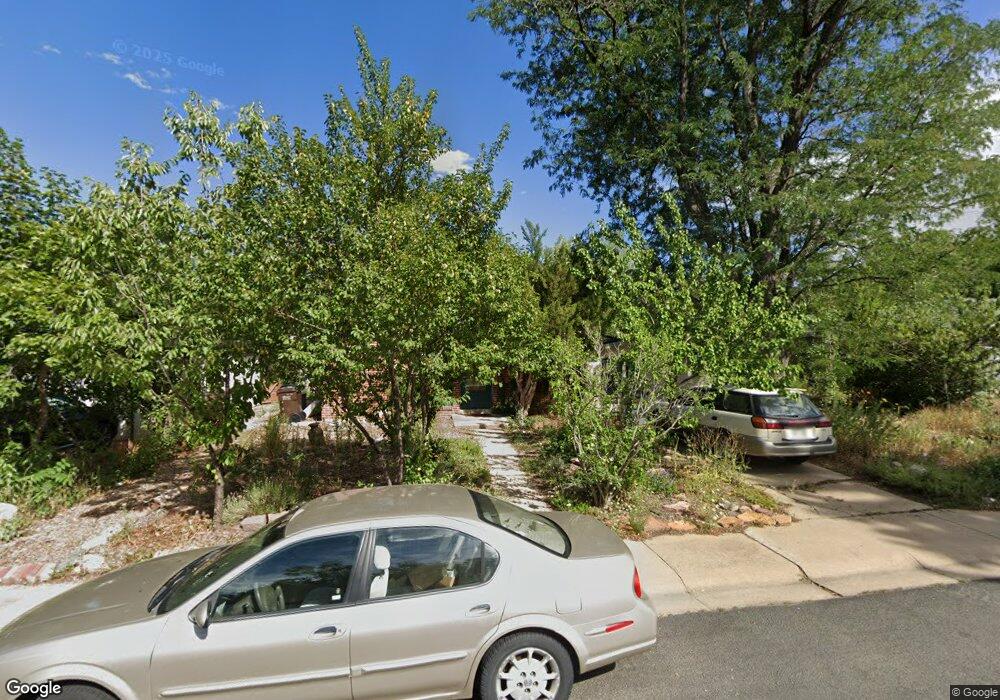
170 S 36th St Boulder, CO 80305
South Boulder NeighborhoodEstimated Value: $747,000 - $888,000
3
Beds
1
Bath
1,053
Sq Ft
$783/Sq Ft
Est. Value
About This Home
This home is located at 170 S 36th St, Boulder, CO 80305 and is currently estimated at $824,765, approximately $783 per square foot. 170 S 36th St is a home located in Boulder County with nearby schools including Creekside Elementary School, Manhattan Middle School of the Arts & Academics, and Fairview High School.
Ownership History
Date
Name
Owned For
Owner Type
Purchase Details
Closed on
Jan 15, 2025
Sold by
Lajeunesse Daniel J and Wiens Marcia L
Bought by
Dan And Marcia Living Trust and Lajeunesse
Current Estimated Value
Purchase Details
Closed on
Feb 5, 1990
Bought by
Wiens Marcia L and Lajeunesse Daniel J
Purchase Details
Closed on
Oct 23, 1989
Bought by
Wiens Marcia L and Lajeunesse Daniel J
Purchase Details
Closed on
Jun 24, 1974
Bought by
Wiens Marcia L and Lajeunesse Daniel J
Create a Home Valuation Report for This Property
The Home Valuation Report is an in-depth analysis detailing your home's value as well as a comparison with similar homes in the area
Home Values in the Area
Average Home Value in this Area
Purchase History
| Date | Buyer | Sale Price | Title Company |
|---|---|---|---|
| Dan And Marcia Living Trust | -- | None Listed On Document | |
| Dan And Marcia Living Trust | -- | None Listed On Document | |
| Wiens Marcia L | $82,000 | -- | |
| Wiens Marcia L | -- | -- | |
| Wiens Marcia L | -- | -- |
Source: Public Records
Tax History
| Year | Tax Paid | Tax Assessment Tax Assessment Total Assessment is a certain percentage of the fair market value that is determined by local assessors to be the total taxable value of land and additions on the property. | Land | Improvement |
|---|---|---|---|---|
| 2025 | $4,393 | $47,482 | $39,544 | $7,938 |
| 2024 | $4,393 | $47,482 | $39,544 | $7,938 |
| 2023 | $4,317 | $49,989 | $45,922 | $7,752 |
| 2022 | $3,897 | $41,964 | $34,277 | $7,687 |
| 2021 | $3,716 | $43,172 | $35,264 | $7,908 |
| 2020 | $3,650 | $41,928 | $28,743 | $13,185 |
| 2019 | $3,594 | $41,928 | $28,743 | $13,185 |
| 2018 | $3,316 | $38,246 | $26,208 | $12,038 |
| 2017 | $3,212 | $42,283 | $28,974 | $13,309 |
| 2016 | $2,857 | $33,003 | $17,592 | $15,411 |
| 2015 | $2,705 | $27,080 | $14,567 | $12,513 |
| 2014 | $2,277 | $27,080 | $14,567 | $12,513 |
Source: Public Records
Map
Nearby Homes
- 345 S 38th St
- 3805 Martin Dr
- 210 S 39th St
- 3000 Dartmouth Ave
- 450 S 41st St
- 2955 Stanford Ave
- 2795 Vassar Dr
- 2585 Kohler Dr
- 4453 Hamilton Ct
- 4595 Moorhead Ave
- 725 S 45th St
- 4835 Moorhead Ave
- 4521 Navajo Place
- 2235 Vassar Dr
- 2860 Table Mesa Dr
- 2250 Bluebell Ave
- 780 33rd St
- 4763 Tantra Dr Unit B
- 770 36th St
- 4445 Squires Cir
Your Personal Tour Guide
Ask me questions while you tour the home.