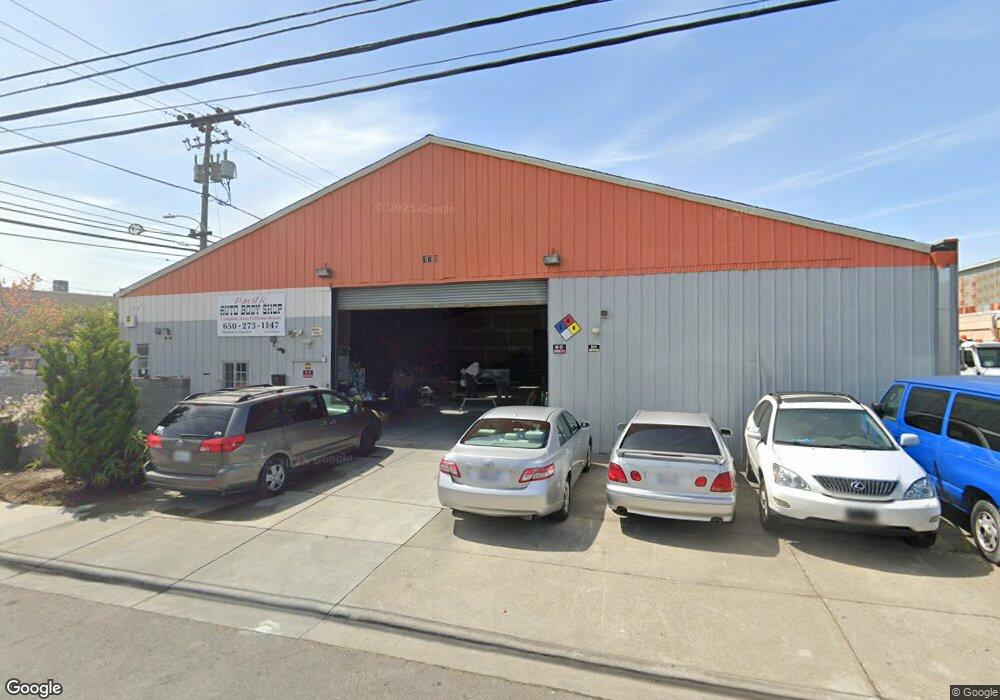
170 S Maple Ave South San Francisco, CA 94080
Orange Park NeighborhoodEstimated Value: $3,659,071
--
Bed
--
Bath
15,360
Sq Ft
$238/Sq Ft
Est. Value
About This Home
This home is located at 170 S Maple Ave, South San Francisco, CA 94080 and is currently estimated at $3,659,071, approximately $238 per square foot. 170 S Maple Ave is a home located in San Mateo County with nearby schools including Los Cerritos Elementary School, Parkway Heights Middle School, and South San Francisco High School.
Ownership History
Date
Name
Owned For
Owner Type
Purchase Details
Closed on
Sep 20, 2017
Sold by
Pradhan Ranjna
Bought by
Coast Point Llc
Current Estimated Value
Home Financials for this Owner
Home Financials are based on the most recent Mortgage that was taken out on this home.
Original Mortgage
$1,440,000
Outstanding Balance
$1,202,502
Interest Rate
3.9%
Mortgage Type
Commercial
Estimated Equity
$2,456,569
Purchase Details
Closed on
May 8, 1998
Sold by
O Reilly Michael J and Kitsman Patricia J
Bought by
Pradhan Dilip and Pradhan Ranjna
Home Financials for this Owner
Home Financials are based on the most recent Mortgage that was taken out on this home.
Original Mortgage
$275,000
Interest Rate
7.13%
Mortgage Type
Commercial
Purchase Details
Closed on
Oct 27, 1994
Sold by
Oreilly Oreilly Michael J Michael J
Bought by
Oreilly Michael J and Kitsman Patricia J
Create a Home Valuation Report for This Property
The Home Valuation Report is an in-depth analysis detailing your home's value as well as a comparison with similar homes in the area
Home Values in the Area
Average Home Value in this Area
Purchase History
| Date | Buyer | Sale Price | Title Company |
|---|---|---|---|
| Coast Point Llc | $2,865,000 | Lawyers Title Company | |
| Pradhan Dilip | $550,000 | Old Republic Title Ins Compa | |
| Oreilly Michael J | -- | -- |
Source: Public Records
Mortgage History
| Date | Status | Borrower | Loan Amount |
|---|---|---|---|
| Open | Coast Point Llc | $1,440,000 | |
| Previous Owner | Pradhan Dilip | $275,000 | |
| Closed | Pradhan Dilip | $220,000 |
Source: Public Records
Tax History Compared to Growth
Tax History
| Year | Tax Paid | Tax Assessment Tax Assessment Total Assessment is a certain percentage of the fair market value that is determined by local assessors to be the total taxable value of land and additions on the property. | Land | Improvement |
|---|---|---|---|---|
| 2025 | $36,080 | $3,259,876 | $3,032,313 | $227,563 |
| 2023 | $36,080 | $3,133,292 | $2,914,565 | $218,727 |
| 2022 | $33,405 | $3,071,856 | $2,857,417 | $214,439 |
| 2021 | $32,738 | $3,011,625 | $2,801,390 | $210,235 |
| 2020 | $32,540 | $2,980,746 | $2,772,666 | $208,080 |
| 2019 | $31,977 | $2,922,300 | $2,718,300 | $204,000 |
| 2018 | $33,098 | $2,865,000 | $2,665,000 | $200,000 |
| 2017 | $9,161 | $756,696 | $412,745 | $343,951 |
| 2016 | $9,130 | $741,859 | $404,652 | $337,207 |
| 2015 | $8,652 | $730,716 | $398,574 | $332,142 |
| 2014 | $8,330 | $716,403 | $390,767 | $325,636 |
Source: Public Records
Map
Nearby Homes
- 20 Maple Ave
- 322 Commercial Ave
- 453 Grand Ave
- 69 Atlantic Ave
- 632 1st Ln
- 219 Miller Ave
- 400 Miller Ave
- 645 Baden Ave Unit 4
- 56 Scott St
- 573 Miller Ave
- 719 Circle Ct
- 311 Magnolia Ave
- 577 Miller Ave
- 1078 Montgomery Ave
- 214 Manor Dr
- 729 Grand Ave
- 247 Rainier Ave
- 553 Diamond Ave
- 728 Cottonwood Ave
- 959 Easton Ave
- 143 S Maple Ave
- 434 Victory Ave
- 434 Victory Ave
- 442 Victory Ave
- 451 Victory Ave Unit 1
- 233 Ryan Way
- 100 S Linden Ave
- 121 S Maple Ave Unit 8
- 150 Starlite St
- 161 S Spruce Ave
- 125 Starlite St
- 233 S Maple Ave
- 221 S Spruce Ave
- 401 S Canal St Unit 401-421
- 401 S Canal St
- 140 S Linden Ave Unit D
- 405 S Canal St
- 125 S Linden Ave
- 170 S Spruce Ave Unit 2nd Floor
- 170 S Spruce Ave Unit Ground Flr