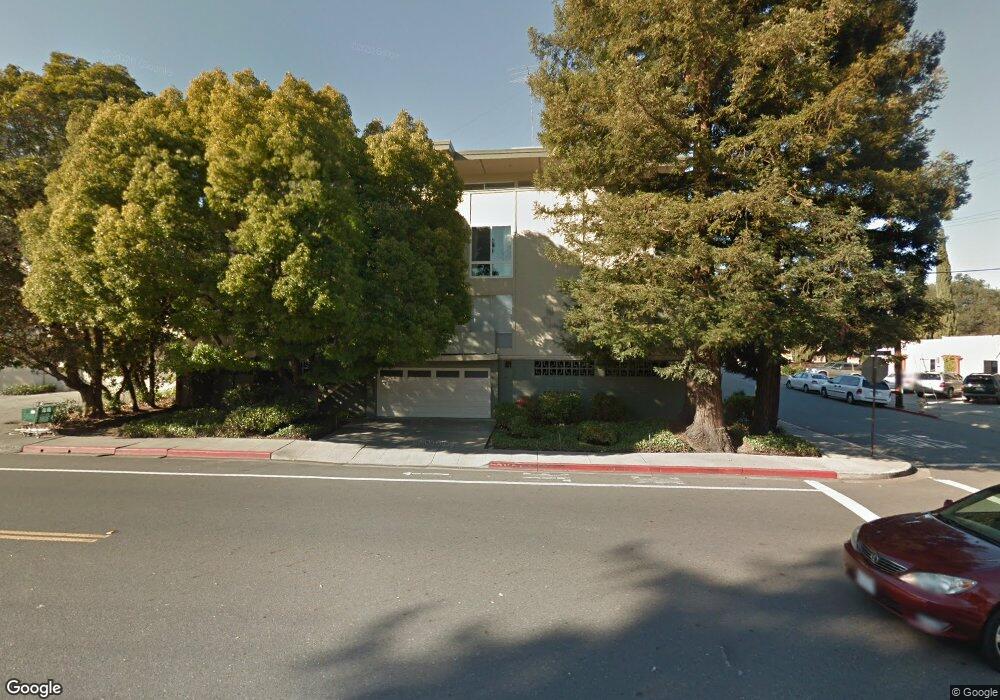
1700 San Carlos Ave Unit 106 San Carlos, CA 94070
Cordes NeighborhoodEstimated Value: $652,000 - $858,000
1
Bed
1
Bath
960
Sq Ft
$767/Sq Ft
Est. Value
About This Home
This home is located at 1700 San Carlos Ave Unit 106, San Carlos, CA 94070 and is currently estimated at $736,703, approximately $767 per square foot. 1700 San Carlos Ave Unit 106 is a home located in San Mateo County with nearby schools including Arundel Elementary School, Tierra Linda Middle School, and Carlmont High School.
Create a Home Valuation Report for This Property
The Home Valuation Report is an in-depth analysis detailing your home's value as well as a comparison with similar homes in the area
Home Values in the Area
Average Home Value in this Area
Tax History Compared to Growth
Tax History
| Year | Tax Paid | Tax Assessment Tax Assessment Total Assessment is a certain percentage of the fair market value that is determined by local assessors to be the total taxable value of land and additions on the property. | Land | Improvement |
|---|---|---|---|---|
| 2025 | $4,117 | $206,645 | $41,314 | $165,331 |
| 2023 | $4,117 | $198,622 | $39,710 | $158,912 |
| 2022 | $3,928 | $194,729 | $38,932 | $155,797 |
| 2021 | $3,844 | $190,912 | $38,169 | $152,743 |
| 2020 | $3,770 | $188,955 | $37,778 | $151,177 |
| 2019 | $3,610 | $185,251 | $37,038 | $148,213 |
| 2018 | $3,505 | $181,619 | $36,312 | $145,307 |
| 2017 | $3,429 | $178,058 | $35,600 | $142,458 |
| 2016 | $3,328 | $174,567 | $34,902 | $139,665 |
| 2015 | $3,320 | $171,946 | $34,378 | $137,568 |
| 2014 | $3,129 | $168,579 | $33,705 | $134,874 |
Source: Public Records
Map
Nearby Homes
- 1667 San Carlos Ave Unit 301
- 656 Cedar St Unit 3
- 1555 Cherry St Unit 12
- 21 Highland Ave
- 728 Elm St Unit 205
- 300 Manzanita Ave
- 782 Elm St Unit C
- 657 Walnut St Unit 301
- 39 Madera Ave
- 88 Madera Ave
- 53 Madera Ave
- 65 Madera Ave
- 520 El Camino Real Unit 307
- 560 El Camino Real Unit 404
- 560 El Camino Real Unit 206
- 5 Spring Valley Way
- 158 Manor Dr
- 00 Devonshire
- 70 Ensenada Rd
- 1047 Cherry St
- 1700 San Carlos Ave
- 1700 San Carlos Ave Unit 204
- 1700 San Carlos Ave Unit 101
- 1700 San Carlos Ave Unit 105
- 1700 San Carlos Ave Unit 202
- 1700 San Carlos Ave Unit 203
- 1700 San Carlos Ave Unit 206
- 1700 San Carlos Ave Unit 205
- 1700 San Carlos Ave Unit 302
- 1700 San Carlos Ave Unit 201
- 1700 San Carlos Ave Unit 301
- 1700 San Carlos Ave Unit 103
- 1700 San Carlos Ave Unit 102
- 1700 San Carlos Ave Unit 104
- 1720 San Carlos Ave
- 560 Prospect St
- 1660 San Carlos Ave
- 575 Prospect St
- 1622 San Carlos Ave
- 534 Sycamore St