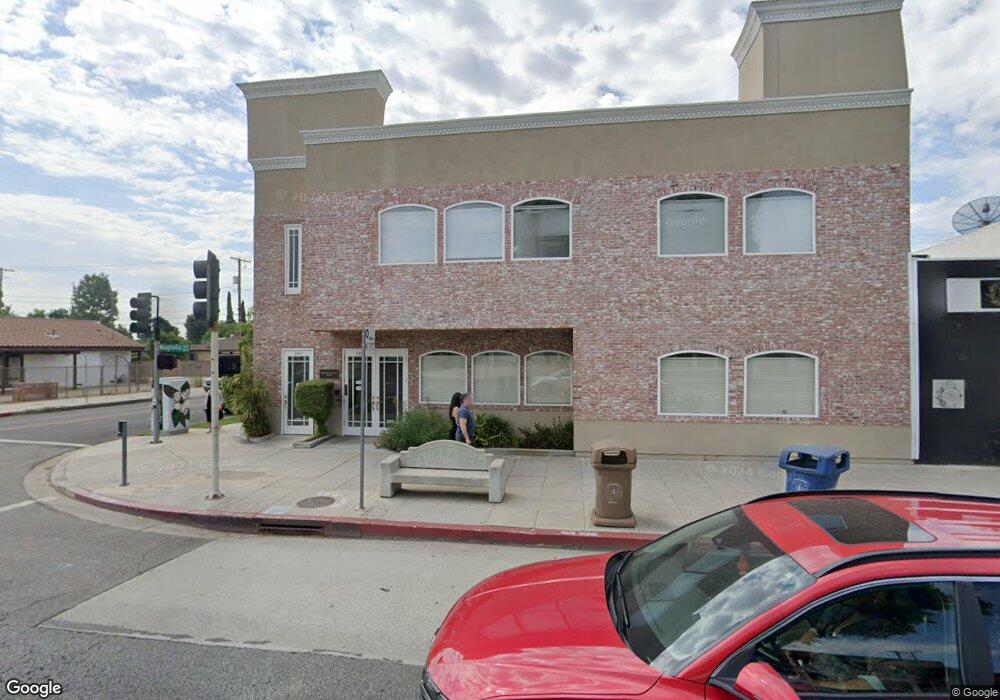
1700 W Magnolia Blvd Unit 200 Burbank, CA 91506
Chandler Park NeighborhoodEstimated Value: $3,373,009
--
Bed
--
Bath
4,448
Sq Ft
$758/Sq Ft
Est. Value
About This Home
This home is located at 1700 W Magnolia Blvd Unit 200, Burbank, CA 91506 and is currently estimated at $3,373,009, approximately $758 per square foot. 1700 W Magnolia Blvd Unit 200 is a home located in Los Angeles County with nearby schools including Walt Disney Elementary School, Dolores Huerta Middle School, and John Burroughs High School.
Ownership History
Date
Name
Owned For
Owner Type
Purchase Details
Closed on
Aug 9, 1999
Sold by
Warner Brett P and Warner Ivonne Cristine
Bought by
Beach Grocery Co Inc
Current Estimated Value
Purchase Details
Closed on
Sep 4, 1996
Sold by
Warner Brett P
Bought by
Warner Brett P and Warner Ivonne Cristine
Purchase Details
Closed on
Aug 20, 1996
Sold by
Warner Ivonne Cristine
Bought by
Warner Brett P
Purchase Details
Closed on
May 8, 1996
Sold by
Fauci Harry Charles and Chuck Fauci Trust
Bought by
Warner Brett P
Purchase Details
Closed on
May 26, 1995
Sold by
Fauci Harry C and Fauci Charles H
Bought by
Fauci Harry Charles and The Chuck Fauci Trust
Purchase Details
Closed on
Feb 17, 1994
Sold by
Fauci Harry C and Fauci Karen M
Bought by
Fauci Karen M and Fauci Harry C
Create a Home Valuation Report for This Property
The Home Valuation Report is an in-depth analysis detailing your home's value as well as a comparison with similar homes in the area
Home Values in the Area
Average Home Value in this Area
Purchase History
| Date | Buyer | Sale Price | Title Company |
|---|---|---|---|
| Beach Grocery Co Inc | $720,000 | Old Republic Title Company | |
| Warner Brett P | -- | -- | |
| Warner Brett P | -- | Old Republic Title Company | |
| Warner Brett P | $180,000 | Old Republic Title Company | |
| Fauci Harry Charles | -- | -- | |
| Fauci Karen M | -- | -- |
Source: Public Records
Tax History Compared to Growth
Tax History
| Year | Tax Paid | Tax Assessment Tax Assessment Total Assessment is a certain percentage of the fair market value that is determined by local assessors to be the total taxable value of land and additions on the property. | Land | Improvement |
|---|---|---|---|---|
| 2025 | $12,935 | $1,145,801 | $442,642 | $703,159 |
| 2024 | $12,935 | $1,123,335 | $433,963 | $689,372 |
| 2023 | $12,802 | $1,101,309 | $425,454 | $675,855 |
| 2022 | $12,230 | $1,079,715 | $417,112 | $662,603 |
| 2021 | $12,167 | $1,058,545 | $408,934 | $649,611 |
| 2019 | $11,683 | $1,036,028 | $396,805 | $639,223 |
| 2018 | $11,539 | $1,015,889 | $389,025 | $626,864 |
| 2016 | $10,938 | $967,910 | $373,920 | $593,990 |
| 2015 | $10,719 | $953,372 | $368,304 | $585,068 |
| 2014 | $10,699 | $934,698 | $361,090 | $573,608 |
Source: Public Records
Map
Nearby Homes
- 430 N Parish Place
- 500 N Lamer St
- 608 N Sparks St
- 233 N Sparks St
- 340 N Mariposa St
- 1713 1715 W Victory
- 830 N Reese Place
- 311 N Lomita St
- 731 N Beachwood Dr
- 510 N Shelton St Unit 2
- 831 N Myers St
- 930 N Keystone St
- 1105 W Clark Ave Unit D
- 452 N Lomita St
- 325 N Glenwood Place
- 835 N Lincoln St
- 516 N Brighton St
- 405 N Brighton St
- 1232 N Lincoln St
- 114 S Lamer St
- 1712 W Magnolia Blvd
- 1620 W Magnolia Blvd
- 533 N Reese Place
- 1616 W Magnolia Blvd
- 1711 W Magnolia Blvd
- 531 N Reese Place
- 532 N Reese Place
- 534 N Orchard Dr
- 1719 W Magnolia Blvd
- 526 N Reese Place
- 525 N Reese Place
- 530 N Orchard Dr
- 1723 W Magnolia Blvd
- 613 N Reese Place Unit A
- 613 N Reese Place
- 522 N Reese Place
- 1606 W Magnolia Blvd
- 524 N Orchard Dr
- 521 N Reese Place
- 610 N Orchard Dr