1701 E 16th St Muncie, IN 47302
Southside NeighborhoodEstimated Value: $17,000 - $114,000
3
Beds
1
Bath
948
Sq Ft
$80/Sq Ft
Est. Value
About This Home
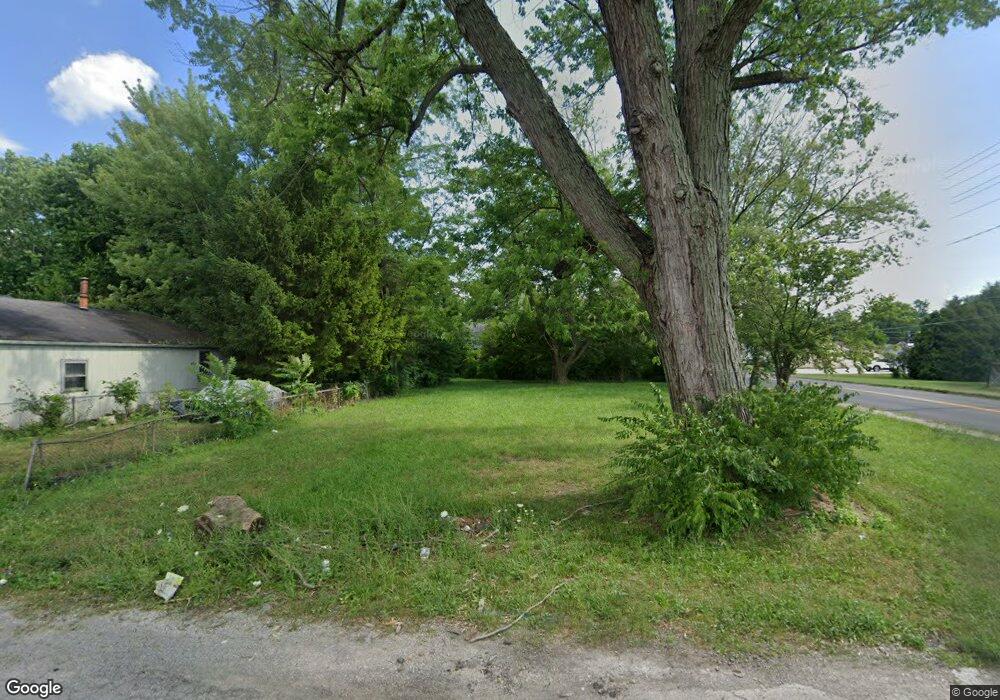
This home is located at 1701 E 16th St, Muncie, IN 47302 and is currently estimated at $75,667, approximately $79 per square foot. 1701 E 16th St is a home located in Delaware County with nearby schools including Grissom Memorial Elementary School, Muncie Central High School, and Southside Middle School.
Ownership History
Date
Name
Owned For
Owner Type
Purchase Details
Closed on
Oct 4, 2022
Sold by
Brooks Button
Bought by
Stewart Fredrick J
Current Estimated Value
Purchase Details
Closed on
Jul 12, 2022
Sold by
Board Of Commissioners
Bought by
Brooks Button
Purchase Details
Closed on
Jul 11, 2022
Sold by
Delaware County
Bought by
Delaware County Commissioners
Purchase Details
Closed on
Feb 12, 2014
Sold by
Myers Billie J
Bought by
Derryberry Kelcy Leroy
Home Financials for this Owner
Home Financials are based on the most recent Mortgage that was taken out on this home.
Original Mortgage
$20,000
Interest Rate
4.45%
Mortgage Type
Seller Take Back
Purchase Details
Closed on
Dec 6, 2012
Sold by
Christian Peggy and Myers Beverly
Bought by
Myers Billie J
Purchase Details
Closed on
Oct 23, 2009
Sold by
Myers Beverly J and Christian Peggy
Bought by
Myers Billie
Purchase Details
Closed on
May 19, 2009
Sold by
Divens Brenda Kay
Bought by
Christian Peggy and Myers Beverly
Create a Home Valuation Report for This Property
The Home Valuation Report is an in-depth analysis detailing your home's value as well as a comparison with similar homes in the area
Home Values in the Area
Average Home Value in this Area
Purchase History
| Date | Buyer | Sale Price | Title Company |
|---|---|---|---|
| Stewart Fredrick J | -- | None Listed On Document | |
| Brooks Button | $600 | None Listed On Document | |
| Delaware County Commissioners | $10,426 | None Listed On Document | |
| Derryberry Kelcy Leroy | -- | -- | |
| Myers Billie J | -- | None Available | |
| Myers Billie | $6,806 | None Available | |
| Christian Peggy | -- | Landamerica |
Source: Public Records
Mortgage History
| Date | Status | Borrower | Loan Amount |
|---|---|---|---|
| Previous Owner | Derryberry Kelcy Leroy | $20,000 | |
| Closed | Myers Billie | $0 |
Source: Public Records
Tax History
| Year | Tax Paid | Tax Assessment Tax Assessment Total Assessment is a certain percentage of the fair market value that is determined by local assessors to be the total taxable value of land and additions on the property. | Land | Improvement |
|---|---|---|---|---|
| 2025 | $118 | $3,600 | $3,600 | $0 |
| 2024 | $118 | $3,600 | $3,600 | $0 |
| 2023 | $129 | $3,600 | $3,600 | $0 |
| 2022 | $10 | $3,600 | $3,600 | $0 |
| 2021 | $118 | $16,200 | $8,800 | $7,400 |
| 2020 | $3,153 | $23,100 | $9,900 | $13,200 |
| 2019 | $4,318 | $23,100 | $9,900 | $13,200 |
| 2018 | $271 | $23,100 | $9,900 | $13,200 |
| 2017 | $971 | $24,000 | $11,000 | $13,000 |
| 2016 | $118 | $23,400 | $11,000 | $12,400 |
| 2014 | $241 | $28,300 | $10,400 | $17,900 |
| 2013 | -- | $28,100 | $10,400 | $17,700 |
Source: Public Records
Map
Nearby Homes
- 1804 E 19th St
- 1805 E 20th St
- 2202 S Penn St
- 2108 S Grant St
- 2007 S Penn St
- 1914 E 23rd St
- 2314 S Ebright St
- 1525 E 23rd St
- 1914 E 24th St
- 2628 S Meeker Ave
- 2717 S Meeker Ave
- 2312 E 22nd St
- 1527 S Ribble Ave
- 2710 S Hackley St
- 1921 S Hackley St
- 1403 S Shipley St
- 808 E 13th St
- 2900 S Chippewa Ln
- 1424 S Meeker Ave
- 1202 S Shipley St
- 1703 E 16th St
- 1705 E 16th St
- 1702 E 17th St
- 2311 S Macedonia Ave
- 1707 E 16th St
- 1700 E 17th St
- 1704 E 17th St
- 1710 E 16th St
- 1620 E 17th St
- 1800 E 16th St
- 1803 E 16th St
- 1610 E 17th St
- 1713 E 15th St
- 1800 E 17th St
- 1808 E 17th St
- 1802 E 16th St
- 1801 E 15th St
- 1701 E 17th St
- 2101 S Macedonia Ave
- 1703 E 17th St
Your Personal Tour Guide
Ask me questions while you tour the home.