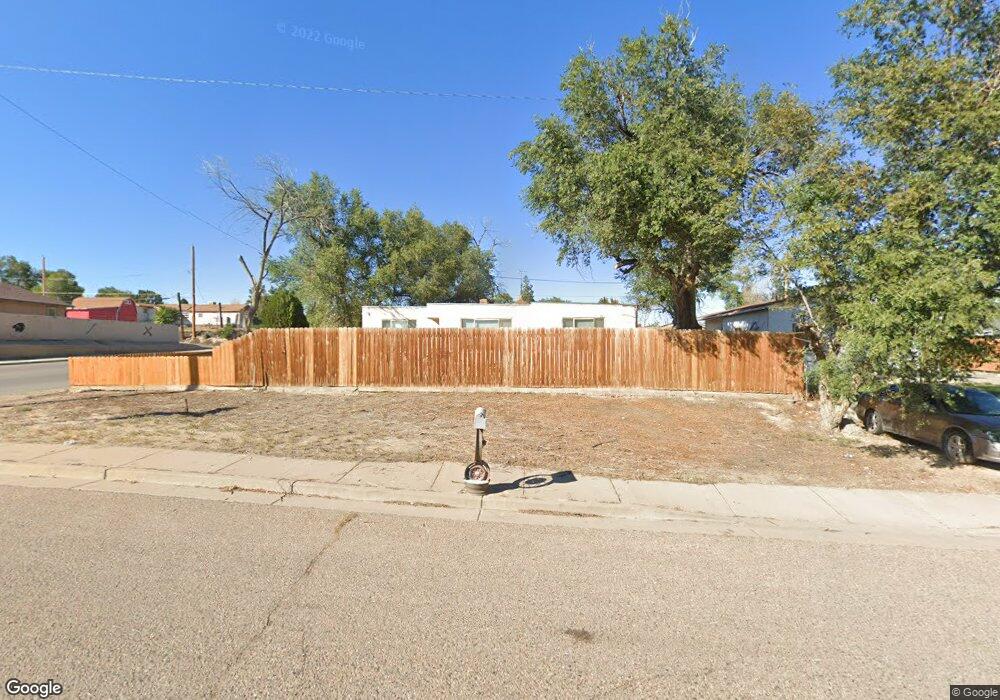
1701 E Ash St Pueblo, CO 81001
Lower East Side NeighborhoodEstimated Value: $173,336 - $195,000
3
Beds
1
Bath
1,227
Sq Ft
$149/Sq Ft
Est. Value
About This Home
This home is located at 1701 E Ash St, Pueblo, CO 81001 and is currently estimated at $183,334, approximately $149 per square foot. 1701 E Ash St is a home located in Pueblo County with nearby schools including Bradford Elementary School, Risley International Academy of Innovation, and East High School.
Ownership History
Date
Name
Owned For
Owner Type
Purchase Details
Closed on
Aug 9, 2016
Sold by
Loans4homes Inc
Bought by
Abbott Randy D
Current Estimated Value
Purchase Details
Closed on
Jul 28, 2000
Sold by
Evergreen Investments Llc
Bought by
Giron J R + H A
Purchase Details
Closed on
Jul 5, 2000
Sold by
Espinoza J R J and Espinoza Mosier H
Bought by
Evergreen Investments Llc
Purchase Details
Closed on
Feb 13, 1998
Sold by
Vallejos Eliseo + Eva
Bought by
Espinoza J R J and Espinoza Mosier H
Purchase Details
Closed on
Feb 3, 1998
Sold by
Sanchez
Bought by
Vallejos Eliseo + Eva
Purchase Details
Closed on
Feb 28, 1992
Bought by
Vallejos Eliseo and Vallejos Eva
Purchase Details
Closed on
Oct 25, 1985
Sold by
Lavato Sanchez M and Lavato Elizab
Purchase Details
Closed on
Jun 14, 1983
Bought by
Lavato Sanchez M and Lavato Elizab
Purchase Details
Closed on
Sep 18, 1974
Sold by
Steed Anna L
Bought by
Same
Create a Home Valuation Report for This Property
The Home Valuation Report is an in-depth analysis detailing your home's value as well as a comparison with similar homes in the area
Home Values in the Area
Average Home Value in this Area
Purchase History
We collect this data history from publicly available records. To have your information removed, we recommend requesting removal directly through your county’s website.
| Date | Buyer | Sale Price | Title Company |
|---|---|---|---|
| Abbott Randy D | -- | None Available | |
| Abbott Randy D | -- | None Available | |
| Giron J R + H A | $68,500 | -- | |
| Evergreen Investments Llc | -- | -- | |
| Espinoza J R J | -- | -- | |
| Vallejos Eliseo + Eva | -- | -- | |
| Vallejos Eliseo | -- | -- | |
| -- | -- | -- | |
| Lavato Sanchez M | -- | -- | |
| Same | -- | -- |
Source: Public Records
Tax History
| Year | Tax Paid | Tax Assessment Tax Assessment Total Assessment is a certain percentage of the fair market value that is determined by local assessors to be the total taxable value of land and additions on the property. | Land | Improvement |
|---|---|---|---|---|
| 2025 | $895 | $8,990 | -- | -- |
| 2024 | $672 | $6,810 | -- | -- |
| 2023 | $680 | $10,500 | $1,010 | $9,490 |
| 2022 | $685 | $6,900 | $540 | $6,360 |
| 2021 | $706 | $7,090 | $550 | $6,540 |
| 2020 | $521 | $7,090 | $550 | $6,540 |
| 2019 | $520 | $5,154 | $375 | $4,779 |
| 2018 | $349 | $3,855 | $378 | $3,477 |
| 2017 | $353 | $3,855 | $378 | $3,477 |
| 2016 | $2,834 | $3,647 | $418 | $3,229 |
| 2015 | $165 | $3,647 | $418 | $3,229 |
| 2014 | $388 | $4,283 | $418 | $3,865 |
Source: Public Records
Map
Nearby Homes
- 1632 E 2nd St
- 1520 E Ash St
- 1826 E 3rd St
- 1430 E Beech St
- 1909 E 2nd St
- 1522 E 4th St
- 1347 Rivers Run Ave
- 0000 E Beech St
- 2908 1/2 E 4th St
- 1513 E 4th St
- 1835 E 4th St
- 703 Pineda Ct
- 725 S Norwood Ave
- 1510 Grenadillo St
- 1420 Brewery Rd
- 717 E Ash St
- 1505 E 6th St
- 1713 E 7th St
- 1506 E 7th St
- 1916 E 7th St
Your Personal Tour Guide
Ask me questions while you tour the home.