1704 1st St Sparks, NV 89431
McCarran Boulevard-Probasco NeighborhoodEstimated Value: $388,000 - $395,000
3
Beds
1
Bath
1,092
Sq Ft
$359/Sq Ft
Est. Value
About This Home
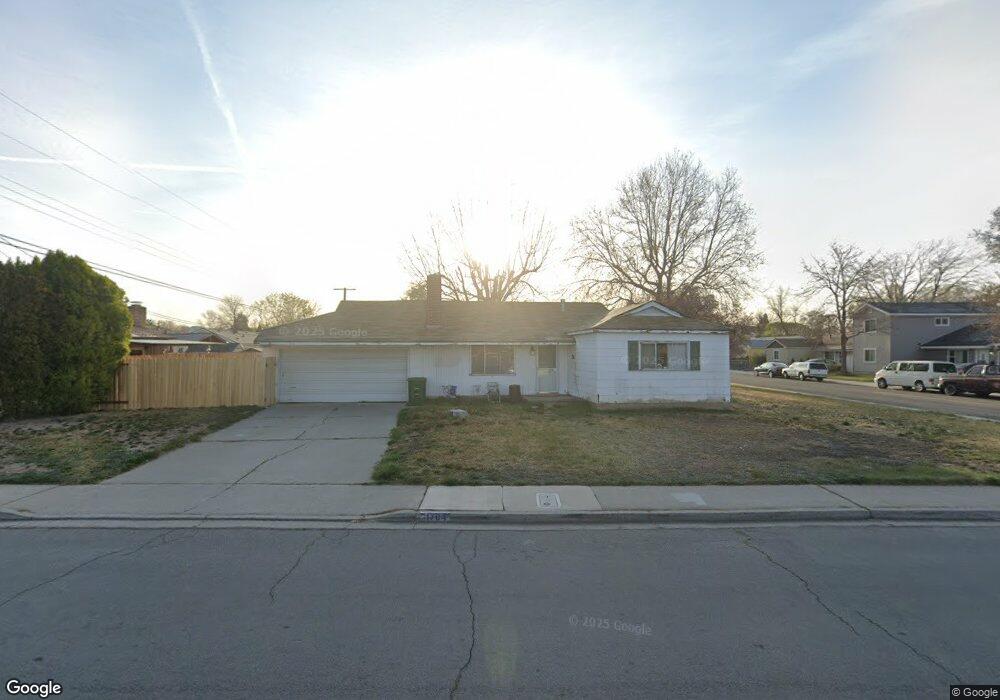
This home is located at 1704 1st St, Sparks, NV 89431 and is currently estimated at $391,872, approximately $358 per square foot. 1704 1st St is a home located in Washoe County with nearby schools including Greenbrae Elementary School, George L Dilworth Middle School, and Sparks High School.
Ownership History
Date
Name
Owned For
Owner Type
Purchase Details
Closed on
May 22, 2001
Sold by
Means Scott L and Means Kristy D
Bought by
Mcmullen Raymond L and Mcmullen Darcia
Current Estimated Value
Home Financials for this Owner
Home Financials are based on the most recent Mortgage that was taken out on this home.
Original Mortgage
$124,000
Outstanding Balance
$46,678
Interest Rate
7.14%
Mortgage Type
VA
Estimated Equity
$345,194
Purchase Details
Closed on
Apr 14, 1997
Sold by
Becker Robert Allan
Bought by
Means Scott L and Inks Tiffany J
Home Financials for this Owner
Home Financials are based on the most recent Mortgage that was taken out on this home.
Original Mortgage
$115,133
Interest Rate
7.86%
Mortgage Type
FHA
Purchase Details
Closed on
Apr 23, 1996
Sold by
Becker Robert Allan and Hall Mary Evelyn
Bought by
Becker Robert Allan
Create a Home Valuation Report for This Property
The Home Valuation Report is an in-depth analysis detailing your home's value as well as a comparison with similar homes in the area
Home Values in the Area
Average Home Value in this Area
Purchase History
| Date | Buyer | Sale Price | Title Company |
|---|---|---|---|
| Mcmullen Raymond L | $127,500 | First American Title | |
| Means Scott L | -- | First American Title | |
| Means Scott L | $116,000 | Stewart Title | |
| Becker Robert Allan | -- | -- |
Source: Public Records
Mortgage History
| Date | Status | Borrower | Loan Amount |
|---|---|---|---|
| Open | Mcmullen Raymond L | $124,000 | |
| Previous Owner | Means Scott L | $115,133 |
Source: Public Records
Tax History Compared to Growth
Tax History
| Year | Tax Paid | Tax Assessment Tax Assessment Total Assessment is a certain percentage of the fair market value that is determined by local assessors to be the total taxable value of land and additions on the property. | Land | Improvement |
|---|---|---|---|---|
| 2025 | $670 | $50,016 | $33,565 | $16,451 |
| 2024 | $670 | $46,307 | $30,065 | $16,242 |
| 2023 | $469 | $46,351 | $31,325 | $15,026 |
| 2022 | $634 | $38,388 | $26,180 | $12,208 |
| 2021 | $617 | $29,893 | $17,955 | $11,938 |
| 2020 | $597 | $28,653 | $16,940 | $11,713 |
| 2019 | $579 | $26,960 | $15,890 | $11,070 |
| 2018 | $563 | $22,334 | $11,725 | $10,609 |
| 2017 | $547 | $20,812 | $10,395 | $10,417 |
| 2016 | $532 | $19,779 | $9,345 | $10,434 |
| 2015 | $532 | $17,936 | $7,700 | $10,236 |
| 2014 | $518 | $16,118 | $6,440 | $9,678 |
| 2013 | -- | $13,685 | $4,270 | $9,415 |
Source: Public Records
Map
Nearby Homes
- 1703 1st St
- 8 E O St
- 1940 4th St Unit 20
- 1940 4th St Unit 51
- 1945 4th St Unit 32
- 1945 4th St Unit 33
- 1945 4th St Unit 10
- 300 I St
- 370 O'Brien Way
- 10 Sheridan Way
- 385 Gleeson Way
- 345 H St
- 119 Devere Way
- 1705 9th St
- 10 Lincoln Way
- 848 Parkside Dr Unit 1
- 120 E Lenwood Dr
- 1023 Tyler Way
- 465 Lenwood Dr
- 1003 Sbragia Way