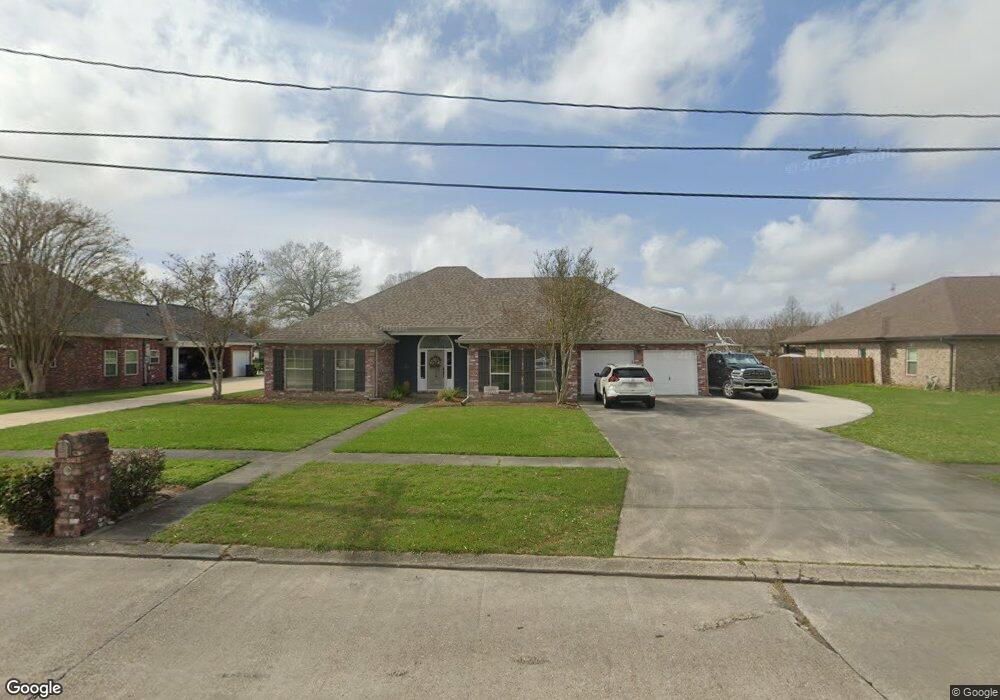
1704 Polk St Houma, LA 70360
Sugar Mill NeighborhoodEstimated Value: $355,367 - $450,000
4
Beds
3
Baths
2,378
Sq Ft
$172/Sq Ft
Est. Value
About This Home
This home is located at 1704 Polk St, Houma, LA 70360 and is currently estimated at $408,592, approximately $171 per square foot. 1704 Polk St is a home located in Terrebonne Parish with nearby schools including Mulberry Elementary School, Houma Junior High School, and Terrebonne High School.
Ownership History
Date
Name
Owned For
Owner Type
Purchase Details
Closed on
Nov 15, 2024
Sold by
James Guy Jr Ricky and Cook Jamie
Bought by
Belling Matthew
Current Estimated Value
Home Financials for this Owner
Home Financials are based on the most recent Mortgage that was taken out on this home.
Original Mortgage
$417,332
Outstanding Balance
$413,177
Interest Rate
6.12%
Mortgage Type
VA
Estimated Equity
-$4,585
Purchase Details
Closed on
Dec 12, 2014
Sold by
Bourgeois Charlotte Marcel and Bourgeois Royce J
Bought by
Gibson Bryan Joseph and Gibson Tammy Galtier
Home Financials for this Owner
Home Financials are based on the most recent Mortgage that was taken out on this home.
Original Mortgage
$290,700
Interest Rate
4.05%
Mortgage Type
New Conventional
Create a Home Valuation Report for This Property
The Home Valuation Report is an in-depth analysis detailing your home's value as well as a comparison with similar homes in the area
Home Values in the Area
Average Home Value in this Area
Purchase History
| Date | Buyer | Sale Price | Title Company |
|---|---|---|---|
| Belling Matthew | $404,000 | Wfg National Title | |
| Belling Matthew | $404,000 | Wfg National Title | |
| Belling Matthew | $404,000 | Wfg National Title | |
| Gibson Bryan Joseph | $306,000 | Wfg National Title |
Source: Public Records
Mortgage History
| Date | Status | Borrower | Loan Amount |
|---|---|---|---|
| Open | Belling Matthew | $417,332 | |
| Closed | Belling Matthew | $417,332 | |
| Previous Owner | Gibson Bryan Joseph | $290,700 |
Source: Public Records
Tax History Compared to Growth
Tax History
| Year | Tax Paid | Tax Assessment Tax Assessment Total Assessment is a certain percentage of the fair market value that is determined by local assessors to be the total taxable value of land and additions on the property. | Land | Improvement |
|---|---|---|---|---|
| 2024 | $1,740 | $26,030 | $5,080 | $20,950 |
| 2023 | $1,740 | $24,790 | $4,840 | $19,950 |
| 2022 | $1,602 | $24,790 | $4,840 | $19,950 |
| 2021 | $1,394 | $22,800 | $4,840 | $17,960 |
| 2020 | $2,178 | $24,790 | $4,840 | $19,950 |
| 2019 | $2,355 | $24,790 | $4,840 | $19,950 |
| 2018 | $1,528 | $23,610 | $4,610 | $19,000 |
| 2017 | $2,233 | $23,610 | $4,610 | $19,000 |
| 2015 | $1,402 | $22,485 | $4,390 | $18,095 |
| 2014 | $1,438 | $22,485 | $0 | $0 |
| 2013 | $1,424 | $22,485 | $0 | $0 |
Source: Public Records
Map
Nearby Homes
- 1120 Museum Dr
- 207 Regal Row
- 1 Glen Oaks Dr
- 187 Regal Row
- 108 Lindsey Dr
- 157 Regal Row
- 103 Aubrey Dr
- 309 Rue Saint Rachel
- 1801 Harvest Dr
- 322 Rue Saint Rachel
- 126 Oakdale Loop
- 411 Valhi Blvd
- 133 Rue Saint Rachel
- 104 Meandering Way
- 210 Tiger Tail Rd
- 0 Progressive Blvd
- 205 Tiger Tail Rd
- 1029 W Tunnel Blvd
- 222 Tiger Tail Rd
- 201 Rue Christe'
- 1702 Polk St
- 1706 Polk St
- 1708 Polk St
- 1700 Polk St
- 1119 Museum Dr
- 1123 Museum Dr
- 318 Meandering Way
- 314 Meandering Way
- 1707 Polk St
- 1710 Polk St
- 310 Meandering Way
- 1703 Harvest Dr
- 324 Meandering Way
- 1611 Harvest Dr
- 313 Meandering Way
- 1705 Harvest Dr
- 330 Meandering Way
- 1711 Polk St
- 1712 Polk St
- 327 Meandering Way