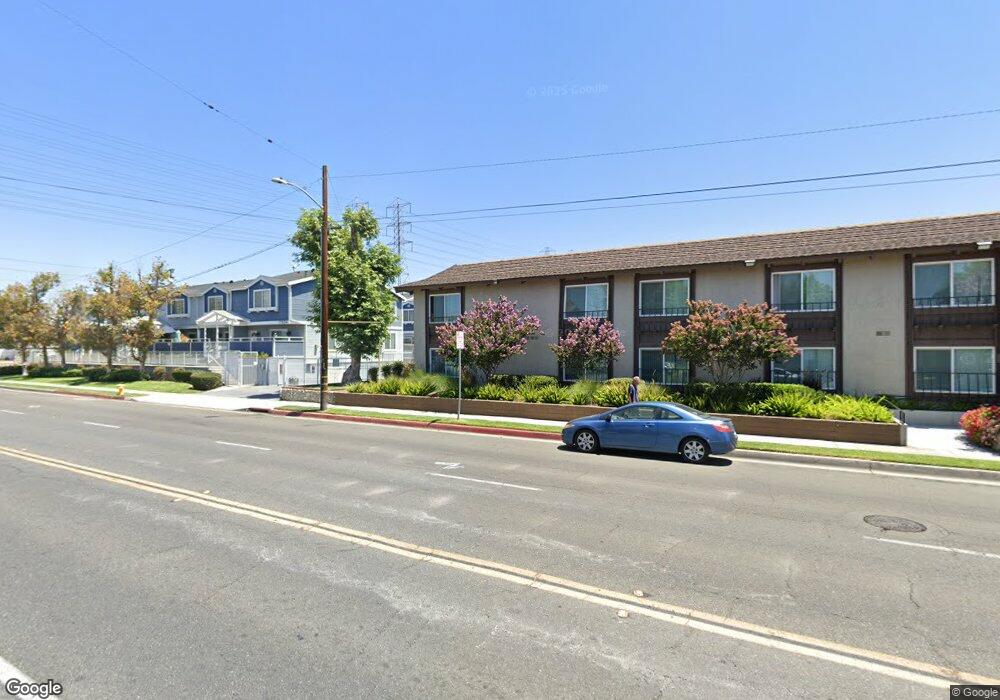
17042 Downey Ave Unit A Bellflower, CA 90706
Estimated Value: $529,000 - $633,000
3
Beds
3
Baths
1,320
Sq Ft
$449/Sq Ft
Est. Value
About This Home
This home is located at 17042 Downey Ave Unit A, Bellflower, CA 90706 and is currently estimated at $592,372, approximately $448 per square foot. 17042 Downey Ave Unit A is a home located in Los Angeles County with nearby schools including Major Lynn Mokler School, Alondra Middle School, and Buena Vista High School.
Ownership History
Date
Name
Owned For
Owner Type
Purchase Details
Closed on
Sep 20, 2017
Sold by
Womak Thomas
Bought by
Womak Thomas and Godfrey Robert
Current Estimated Value
Purchase Details
Closed on
Jan 20, 2011
Sold by
Federal National Mortgage Association
Bought by
Womack Thomas Irwin
Home Financials for this Owner
Home Financials are based on the most recent Mortgage that was taken out on this home.
Original Mortgage
$189,900
Outstanding Balance
$128,785
Interest Rate
4.67%
Mortgage Type
New Conventional
Estimated Equity
$463,587
Purchase Details
Closed on
Oct 19, 2010
Sold by
Mcdaniel Donna
Bought by
Federal National Mortgage Association and Fannie Mae
Purchase Details
Closed on
Mar 31, 1998
Sold by
Wilson Bryan
Bought by
Mcdaniel Donna
Home Financials for this Owner
Home Financials are based on the most recent Mortgage that was taken out on this home.
Original Mortgage
$121,550
Interest Rate
7.15%
Mortgage Type
FHA
Create a Home Valuation Report for This Property
The Home Valuation Report is an in-depth analysis detailing your home's value as well as a comparison with similar homes in the area
Home Values in the Area
Average Home Value in this Area
Purchase History
| Date | Buyer | Sale Price | Title Company |
|---|---|---|---|
| Womak Thomas | -- | None Available | |
| Womak Thomas | -- | None Available | |
| Womack Thomas Irwin | $240,000 | Lsi Title Company Ca | |
| Federal National Mortgage Association | $285,439 | Accommodation | |
| Mcdaniel Donna | $125,000 | Fidelity National Title Ins |
Source: Public Records
Mortgage History
| Date | Status | Borrower | Loan Amount |
|---|---|---|---|
| Open | Womack Thomas Irwin | $189,900 | |
| Previous Owner | Mcdaniel Donna | $121,550 |
Source: Public Records
Tax History
| Year | Tax Paid | Tax Assessment Tax Assessment Total Assessment is a certain percentage of the fair market value that is determined by local assessors to be the total taxable value of land and additions on the property. | Land | Improvement |
|---|---|---|---|---|
| 2025 | $4,016 | $307,340 | $92,748 | $214,592 |
| 2024 | $4,016 | $301,315 | $90,930 | $210,385 |
| 2023 | $3,941 | $295,408 | $89,148 | $206,260 |
| 2022 | $3,834 | $289,616 | $87,400 | $202,216 |
| 2021 | $3,742 | $283,938 | $85,687 | $198,251 |
| 2020 | $3,657 | $281,028 | $84,809 | $196,219 |
| 2019 | $3,831 | $275,519 | $83,147 | $192,372 |
| 2018 | $3,579 | $270,117 | $81,517 | $188,600 |
| 2016 | $3,206 | $259,629 | $78,352 | $181,277 |
| 2015 | $3,024 | $255,731 | $77,176 | $178,555 |
| 2014 | $3,097 | $250,723 | $75,665 | $175,058 |
Source: Public Records
Map
Nearby Homes
- 17100 Downey Ave
- 16840 Passage Ave
- 3420 E 67th St
- 8811 Park St Unit 54
- 3340 E 67th St
- 16819 Hayter Ave
- 3301 E Artesia Blvd
- 16600 Downey Ave Unit 145
- 16600 Downey Ave Unit 27
- 16600 Downey Ave Unit 60
- 16600 Downey Ave Unit 31
- 16600 Downey Ave Unit 115
- 6535 Downey Ave
- 8819 Park St Unit 29
- 6532 Johnson Ave
- 8508 Ramona St
- 8858 Flower St
- 6773 Curtis Ave
- 8025 70th St
- 6404 Indiana Ave
- 17038 Downey Ave
- 17036 Downey Ave
- 17038 Downey Ave Unit C
- 17038 Downey Ave Unit D
- 17038 Downey Ave Unit E
- 17036 Downey Ave Unit A
- 17036 Downey Ave Unit B
- 17036 Downey Ave Unit C
- 17036 Downey Ave Unit D
- 17036 Downey Ave Unit E
- 17034 Downey Ave Unit A
- 17034 Downey Ave Unit B
- 17034 Downey Ave Unit C
- 17034 Downey Ave Unit D
- 17034 Downey Ave Unit E
- 17042 Downey Ave Unit B
- 17042 Downey Ave Unit C
- 17042 Downey Ave Unit D
- 17042 Downey Ave Unit E
- 17040 Downey Ave Unit A
Your Personal Tour Guide
Ask me questions while you tour the home.